Modeling Biological Networks
IV.1 Coordinators
IV.2 Participants
IV.3 Introduction
IV.4 Background and Significance
IV.5 Research Plan IV.6 Specific Subprojects
IV.7 Connection to Specific Projects 2 (cytoskeleton) and 3 (organogenesis)
IV.8 Timeline
< Previous | Page 6 of 35 | Next >
IV.5.ii.c Protein Interaction Networks:
We traditionally characterize proteins by their individual actions as catalysts, signaling molecules, or building blocks of cells. However, recent integrative approaches view them as elements in a network of protein-protein interactions with a "contextual" or "cellular" function within functional modules (Hartwell et al., 1999; Eisenberg et al., 2000). The position of the protein within the protein-protein interaction network reveals its role.
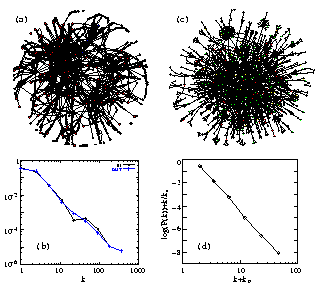
We assessed the topologic characteristics of complete two-hybrid analysis protein-protein interaction networks of the yeast, S. cerevisiae and the bacterium, H. pylori, (Uetz et al., 2000; Rain et al., 2001; Xenarios et al., 2000). The complete maps of the yeast and H. pylori networks (Figure IV.2 c), are too large to provide visual insight into their structure. Figure IV.2 d, shows that the probability that a given yeast protein interacts with k other yeast proteins follows a power-law (Jeong et al., 2000) with an exponential cutoff (Amaral et al., 2000). Similar results apply for H. pylori, indicating that the protein interactions in both bacteria and eukaryotic cells form highly inhomogeneous scale-free networks. An important consequence of inhomogeneous structure is robustness against random errors and fragility if the most connected nodes are removed (Albert et al., 2000).

|
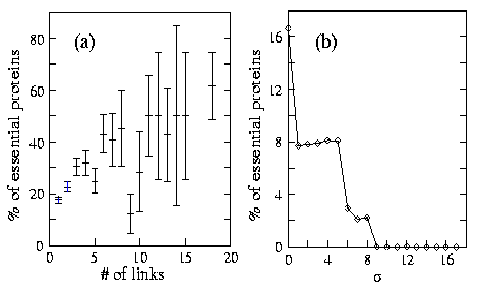
Fig. IV.2. (a) Map of protein-protein interactions in yeast. The color of a node signifies the phenotypic effect of removing the corresponding protein (red=lethal, green=non-lethal, orange=slow growth, yellow=unknown) (b) Connectivity distribution P(k) of interacting proteins giving the probability that a given protein interacts with k other proteins in yeast. (c) Map of the metabolic network in E. coli. (d) Connectivity distribution P(k) for the substrates in E. coli, in a log-log plot, counting separately the incoming (IN) and outgoing links (OUT) for each substrate, kin (kout) corresponding to the number of reactions in which a substrate participates as a product (educt). If the link between topology and error tolerance is biologically relevant, proteins with fewer connections should prove less essential, on average, than highly connected ones. We calculated this correlation and showed that the likelihood that removal of a protein will prove lethal clearly correlates with the protein's number of interactions (Figure IV.3 a). |

|
|
Fig. IV.3. Correlation between lethality and various cellular characteristics. (a) The percentage of lethal proteins of those that have k links in the yeast protein-protein network, indicating that highly connected proteins are more essential to the cell than less connected counterparts. (b) Correlation between the fluctuation in the expression level and lethality in yeast. The plot shows the percentage of proteins that are lethal with standard deviations larger than a given value . No proteins are lethal with >9, and the likelihood of lethality increases abruptly as decreases. For example, while proteins with five or fewer links constitute ~93% of the total, only ~21% of them are essential. In contrast, only ~0.7% of the yeast proteins with known phenotypic profile have more than fifteen links but single deletion of ~62% of these proves lethal. Highly-connected proteins with a central role in the network's architecture are three times more likely to prove essential than proteins with few links to other proteins. |