A Large Scale Comparison of Option
Pricing Models with Historical Market Data
SUMMARY
We obtained market data from the Chicago Board of Option Exchange
for the period 1988-1990, and used six-month records of option trades from
January-June, 1988 for a set of 13 stocks.
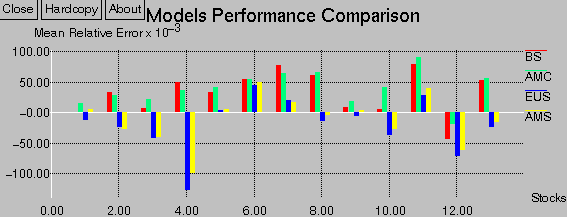
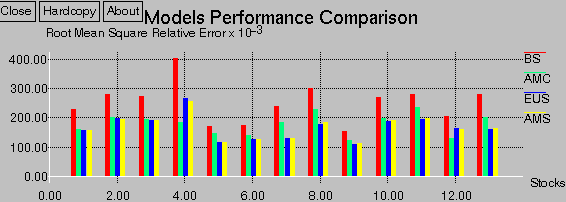
Model accuracy is measured in mean relative error and
root mean square relative error between model price
and market price in dollar. The four models are :
-
BS -- Black-Scholes model;
-
AMC -- American Constant volatility binomial model;
-
EUS -- European Stochastic volatility binomial model;
-
AMS -- American Stochastic volatility binomial model.
8192-node CM2 and 8192-node DECmpp-12000 at NPAC are used to conduct
runs for the two parallel models (EUS and AMS).
Model Performance Comparison Without Optimization of Parameters
In a preliminary comparison, we examined the performance of the four
pricing models using a simple method of parameter estimation. The two graphs below
summarize models comparison on total 13 stocks without opitimized model
parameters.


Detailed comparsion of model bias between model result and market price
for BS and AMS models
on individual stocks WITHOUT opitimized model parameters
can be shown graphically below:
Company Stock Number of Trades Conducted
- AT&T
5230
Bristol Myers Squibb 11390
Chrysler Corp. 11989
Eastman Kodak(1) 1695
Eastman Kodak(2) 7698
Ford Motor Corp. 11756
General Electric 9075
Hewlett Packard 11043
IBM (1) 3300
IBM (2) 19352
Texas Instruments 11291
Walmart 2867
Xerox 1865
*TOTAL* 108851
Model Performance Comparison With Optimization of Parameters
In a refinement of our evaluation of model accuracy, we used optimized techniques
to estimate model parameters.
pricing models using a simple method of parameter estimation. Key model
parameters optimized are initial volatilities, variance of volatility
and correlation between stock price and volatility.
Detailed comparsion of model bias between model result and market price
for BS and AMS models
on individual stocks WITHOUT opitimized model parameters
can be shown graphically below:
Company Stock Number of Trades Conducted
- AT&T
5230
Eastman Kodak(1) 1695
General Electric 9075
Hewlett Packard 11043
IBM (1) 3300
IBM (2) 19352
Texas Instruments 11291
Xerox 1865
*TOTAL* 62851
Northeast Parallel Architectures Center, Syracuse University, npac@npac.syr.edu
This page is maintained by Gang Cheng, gcheng@npac.syr.edu


