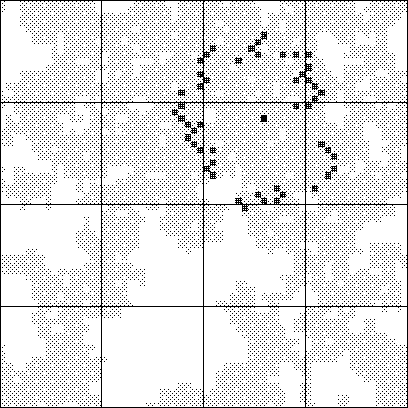

The Wolff cluster is shown here in gray, with the initial site in black. A particular generation of ants is shown in red. The black squares represent processor boundaries for a standard (BLOCK,BLOCK) data distribution. Note that the load balance (number of red sites per processor) is very poor.