Rolling Dice and Deciding who will win the Election
So if you follow the process of an election or the White House or Republicans deciding on the correct strategy, one goes out and takes a poll. Often the same issue is polled by lots of different groups; CNN, New York Times; political parties etc. You may have noticed that most polls use between 500 and 1500 people. Here we will try to show you why!
You may have also noticed that such polls quote a margin of error in their results
e.g. they might say that 50% of the people polled thought Donald Duck would win the election with a margin of an error of 3 percent points. Namely that the actual result is that they predict that somewhere between 47% and 53% of the public would vote for Donald Duck. So this is quite interesting. If all 100 million or so of the US voting population vote, you get the real result. However you can get to within 3% of the answer by just talking to 1000 people – a tiny fraction .00001 of the total. This could save a lot of money on Election Day and says you can stay home and learn more Java unless it is a close election. Actually this is not a very democratic way to think, and everybody should vote – otherwise those that love Java would always stay at home and we would never elect Politicians who program…
So if one makes a poll, the error comes from two sources – the so-called statistical error and the so-called bias. The bias is like we discussed above – one must choose a representative subset of the voters. One must be careful that all key characteristics are represented in the sample of people chosen. This like most hard things, we won’t discuss and it requires great skill to be able to reliably choose a "representative" set of people. So instead, we will discuss the statistical error. This is mathematics and nerds like me can understand it.
The reason why one chooses some 1000 people to poll, is that this will give statistical errors of around 2% and the quoted errors combine this with errors due to a biased sample. There is not much point in using more 1000 or so in a poll as you will decrease the statistical error but it will be hard to decrease the overall error much more.
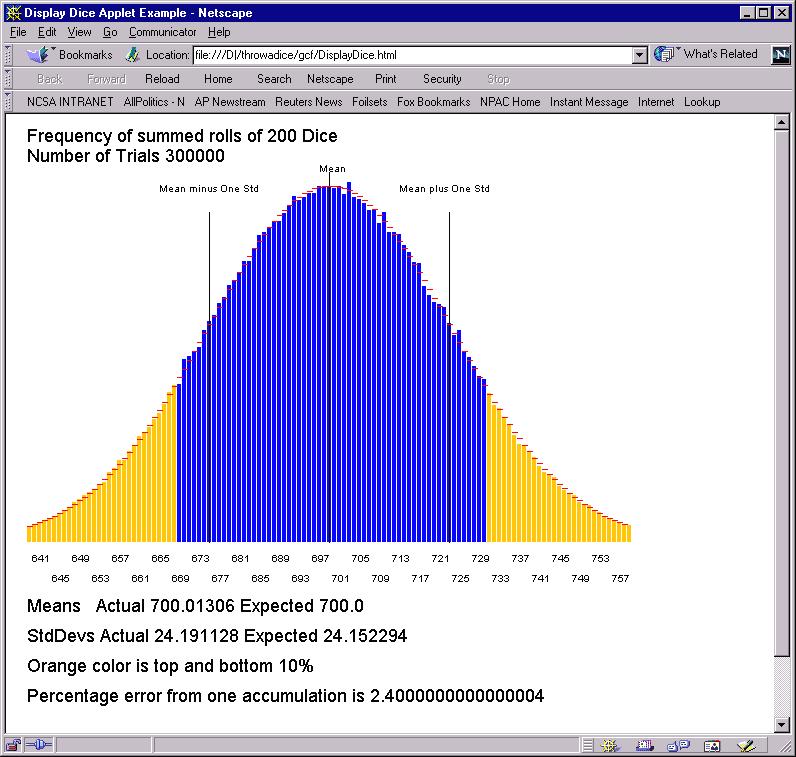
Let us consider the case of rolling 200 Dice and summing the spots. This will lead to a result between 201 and 1200 with an average of 700. Subtracting 200, we get the equivalent of 1000 people with a poll whose result is 50% yes and 50% no. Any one summing of 200 Dice will not get 700 but a value near this. The applet does this process a number totalFrq times and plots the result as a histogram.
As shown above, one finds a percentage error of 2.4%. Note that the histogram is quite a pretty bell shape and in fact there is a fancy theory called the "central limit theorem" which derives the shape as a so-called Gaussian. The expected shape is superimposed as red lines on histogram and the agreement is excellent. There is a separate discussion of Gaussians in these notes.
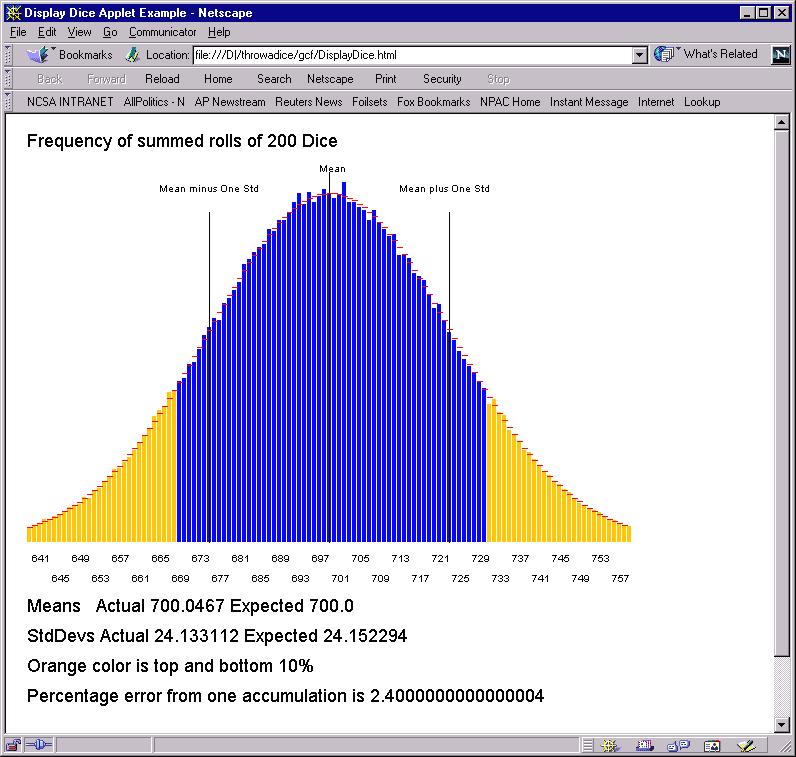
Each time you run the applet, you get somewhat different answers. As shown above, for parameters used here, the change is not significant.
Actually Dice are not a very good representation of polling, as a result with 1000 cells corresponds to only 200 Dice -- this is like polling where you went to households and asked 5 people in each household. It is not 1000 independent samples. So a better model is tossing coins a 1000 (5*numDice) times. We show this below where we keep a consistent diagram by shifting over coin toss by 200 so results do lie in range 201..1200 like the Dice accumulation.
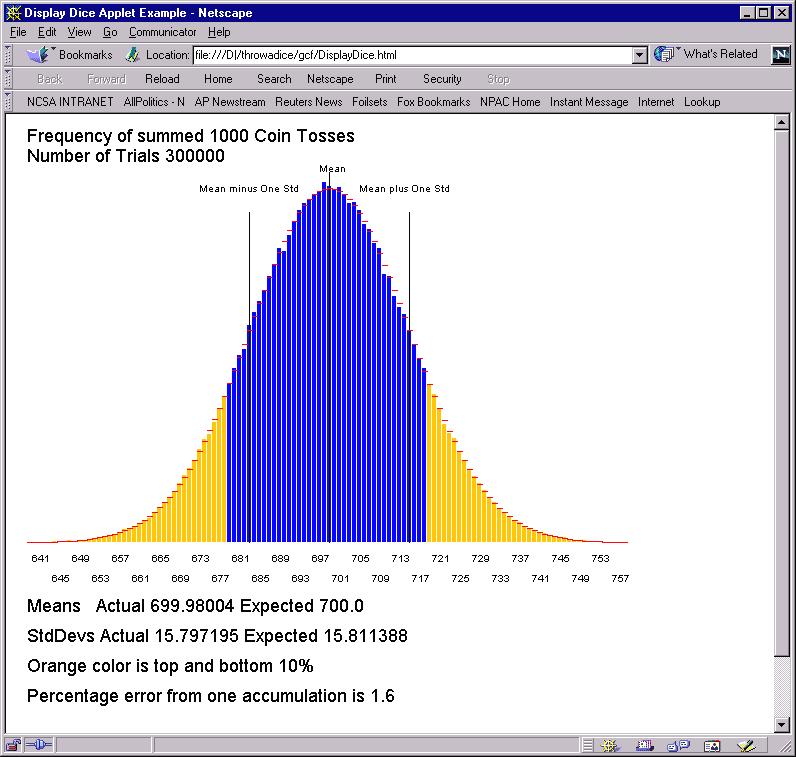
Now the frequency distribution is narrower. It is still a beautiful bell shaped Gaussian but the percentage error is 1.6% not 2.4%. This tells you what you knew; you will get better answers from asking 1 person from 1000 households rather than 5 people from each of 200 households.
Let us now see what happens when we decrease the sample size.
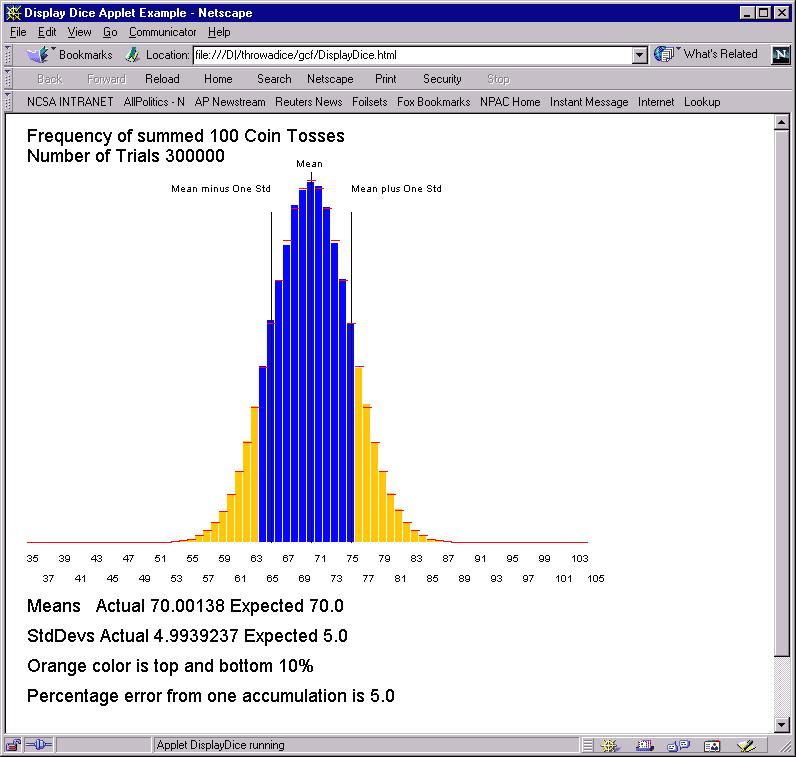
With 100 coin tosses (a polling sample of 100), the statistical error is 5% -- too big to be comfortable. There is a simple rule for such errors -- if you want to halve error, you must quadruple the sample size. Thus with 400 coin tosses:
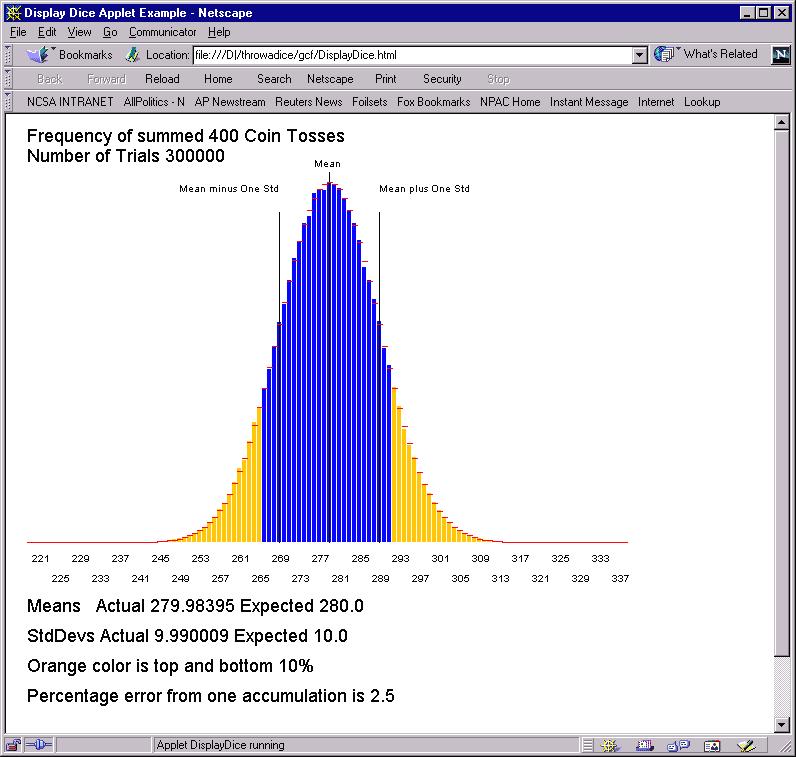
the error is 2.5% which is half the result for 100 coin tosses. If you can do arithmetic, you will find that error with 1000 coin tosses is smaller than that for 100 tosses by a factor of square root(10) or 3.16.
Note that in all the curves, my nifty Gaussian theory (the red lines) is just perfect. We didn't have written the applet and waited while the system ploughed through the computation …..
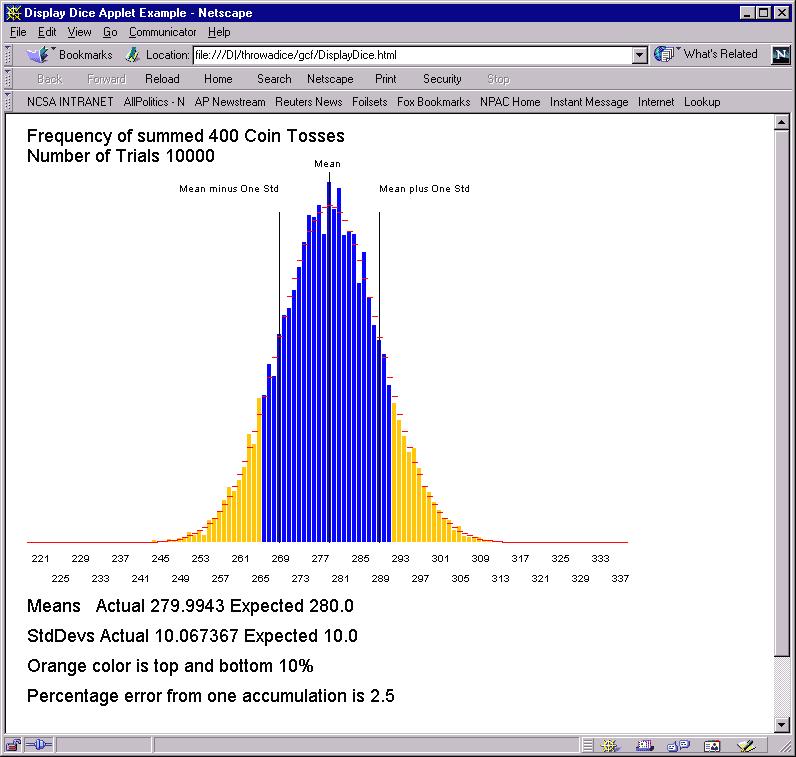
Suppose we reduce the number of trials from the excessive 300,000 to a more immediate 10,000. Then the means come out just fine as shown below but the histogram is more ragged. It is not so near the red lines but has random deviations above and below it
I got a bit worried in these long computations. Was the program running OK? So I used a useful dodge of inserting print statements to the Java Console (
if(i%5000 == 0 ) System.out.println("Generating " +i);) so that one wrote a message every 5000 trials. I also wrote out some messages in paint method to show it had got there. Open the Java console, and you will find stuff like that below: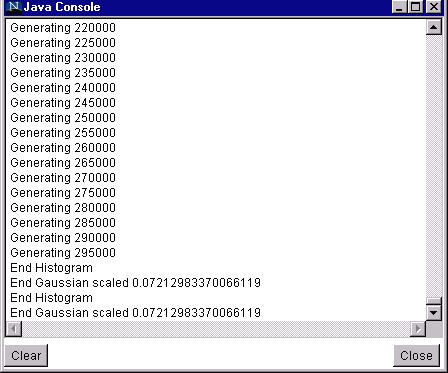
Note messages in paint are repeated each time page reloads but earlier messages from init are not.