Traffic distribution
The traffic distribution page shows the current state of a particular frontend Load Balancer. Listed on the page is each backend machine that the Load Balancer is in contact with. For each machine, the balancer maintains records about how well that webserver is performing and how fast it responds to web page requests.
A guide to the different sections of the page is given below:
Machine
Each of the backend webservers that the frontend Load Balancer knows of is listed. Because this list is provided by the balancer, and not just read from the configuration on the Administration Server, it can serve as a useful guide to see if your Load Balancers are set up correctly. If no backend webservers are listed, it is likely that you have forgotten to copy across the file $ZEUSHOME/webadmin/conf/hosts from the Administration server into $ZEUSHOME/balancer/workers on each of the Balancer installs.Unless you have a huge number of backend machines, there will be a small graphic on the page representing each server. This image is white when the server is working correctly, or red if the server is dead, or has an extremely high response time.
Note that dead backend webservers will only be detected when the Load Balancer attempts to send a webpage request to them. Consequently, on a cluster which has not received any traffic recently, all webservers will appear alive. The Cluster status page, which can be reached by clicking on the back arrow button on the Traffic distribution page, will be able to detect dead webservers for you.
Percentage load
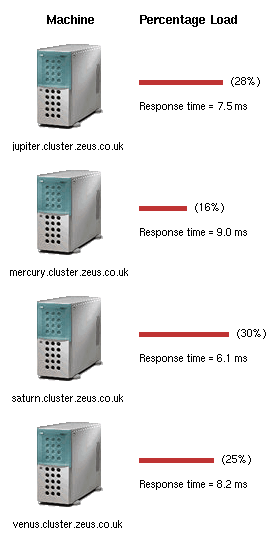
The red bars on the page indicate the current sharing of workload that the Load Balancer is allocating each backend server. This is not a measure of the current CPU usage of each webserver, or in fact a measure of how much work the webserver is processing at the moment. It indicates the proportion of future work that will be given to this server. So, a faster webserver will be given a greater percentage load. This means that more work will be delivered to it.Response time
The figure quoted for the response time is the average time taken for this backend webserver to start returning data after being given a webpage request. The response time is one of the indicators used in sharing the load between webservers.Over time, the Load Balancer scales down the response times of each backend. So, if the cluster has not received many requests recently, you may see response times of 0ms. Likewise, when a backend webserver is found not to be working, it is given an extremely large response time, as well as having its load allocation removed. After a while, the dead machine's response time will fall and the Load Balancer will attempt to add the machine back into the cluster again.

An example cluster
In the sample page on the right, four backend webservers are shown. None of the webservers is coloured red, so they are all working correctly. The percentage load is distributed fairly evenly between all four machines (mercury has slightly less load than the others, but this can be caused by different traffic patterns. For example, mercury may have just received several CPU-intensive page requests, such as running some CGI scripts).
The percentage load values can fluctuate quite rapidly - the page you view contains a brief snapshot of their values. Try reloading the page every few seconds to see how they alter. If one machine has a percentage load that is consistently much lower than the other machines in the cluster, it may be worth checking that machine to see if there are factors affecting its performance.