

Understanding the Errors Found Panel
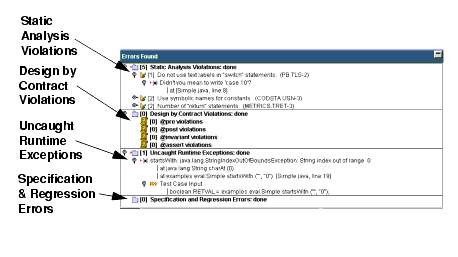
All class test results are displayed in the Class Testing UI's Errors Found panel. The contents of this panel are described below, and in context-sensitive help. If commands are available by right-clicking a particular node, a right-click icon will open when you place your cursor over that node.
The Class Testing UI also provides you with a variety of ways to gain additional information about the test results and to customize what results are reported the next time that this test is run. For more information about these options, see Exploring and Customizing Class Test Results.

All error/violation messages are marked with a bug icon.
The tree displayed in this panel contains the following information:
- Static Analysis Violations: Displays the number of violations that Jtest found while performing static analysis. This branch contains the following information:
- Rule: Name of rule violated. (Rule ID is displayed in parentheses).
Marked with a wizard hat icon.
- Violation: Jtest rule violation message. To suppress this message or view the associated rule description, right-click this node then choose the appropriate command from the shortcut menu.
Marked with a bug icon.
- File/line info: File/line number where violation occurred. To view or edit the source code, right-click this node then choose the appropriate command from the shortcut menu.

- Design by Contract Violations: Displays the number of Design by Contract violations that Jtest found while performing dynamic analysis. Design by Contract violations are organized according to the nature of the violation. This branch contains the following violation categories:
- @pre violations: Contains information about violations that occur when a method is called incorrectly.
- @post violations: Contains information about violations that occur when a method does not return the expected value.
- @invariant violations: Contains information about violations that occur when an @invariant contact condition is not met.
- @assert violations: Contains information about violations that occur when an @assert contact condition is not met.

- Uncaught Runtime Exceptions: Displays the number of uncaught runtime exceptions that Jtest found while performing dynamic analysis. Each uncaught runtime exception is followed by a full stack trace, as well as an example input leading to this exception. This branch contains the following information:
- Exception: Exception found.
Marked with a bug icon.
- Stack trace information: A stack trace like the one that the Java virtual machine would give if a reported uncaught runtime exception were thrown. To view or edit the source code, right-click this node then choose the appropriate command from the shortcut menu. (If the file and line number information is missing, recompile the class with debug information).
- Input that defines the test case: For automatic test cases, this is the calling sequence; for user defined test cases, this is the input for each argument.
If input from a stub caused the exception, stub information will be displayed here. Empty boxes indicate automatically generated stubs. Black boxes indicate user-defined stubs. To see the stack trace where a stub invocation occurred, expand the stub's branch. For more information on stubs, see Testing Classes That Reference External Resources and Using Custom Stubs.
Marked with an arrow icon.

- Specification and Regression Errors: Displays the specification and regression errors that Jtest found while performing dynamic analysis. The errors are determined by comparing the test case outcomes of this run with those of previous runs or those specified by the user. (To view the reference outcomes, open the Class Test Parameters window and browse to Dynamic Analysis> Test Case Evaluation> Specification and Regression Test Cases). This branch contains the following information:
- Error: Specification and regression error found.
Marked with a bug icon.
- Input that defines the test case: For automatic test cases, this is the calling sequence; for user defined test cases, this is the input for each argument.
If input from a stub caused the error, stub information will be displayed here. Empty boxes indicate automatically generated stubs. Black boxes indicate user-defined stubs. To see the stack trace where a stub invocation occurred, expand the stub's branch. For more information on stubs, see Testing Classes That Reference External Resources and Using Custom Stubs.
Marked with an arrow icon.


|


