We have found Java easy to use, and the code is very similar to our research simulations written in C and C++. This has actually worked in reverse now; our latest C++ simulation is based on the structure of the Java code.

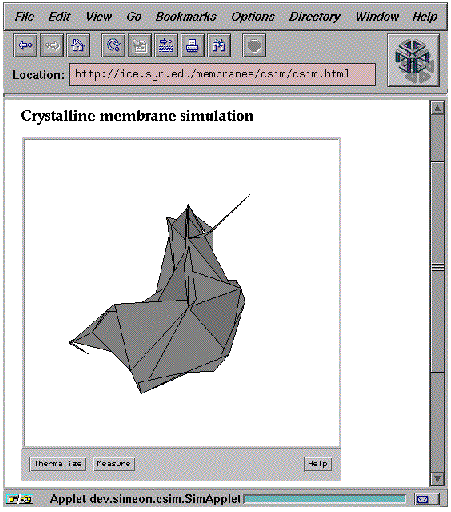
Figure 1: Snapshot of a simple Java applet running a Monte
Carlo simulation of an 88 crystalline 2D membrane.
The applet shown in Fig. 1 allows the viewpoint to be arbitrarily rotated as the membrane evolves under Monte Carlo updates. It uses the OOGL_OFF class written by Daeron Meyer of The Geometry Center [10]. This class has been extended with one new constructor and an update method to do data conversion. In this way, we were able to add display and rotation with very little effort. This applet provided us with useful proof of concept, though the speed of execution limits us to rather small grids (1616 becomes quite slow), mainly because of graphics speed. However, this varies widely and is improving on all platforms as new implementations become available.
VRML is an obvious choice for 3D displays. We have made static VRML worlds from membrane examples with promising results. Although the VRML viewer we used (Silicon Graphics Inc. Cosmo 1.0 on Irix) could render very much faster and better than our Java code, a 3333 mesh was still unacceptably slow on an Silicon Graphics Inc. Indy workstation. Typical research simulations are 64 or 128 nodes square.
VRML alone is not enough, as we need to have text for explanation and instructions. New products integrating VRML and Java may provide good solutions to this. The ideal scenario would be the ability to create a VRML component within a Java applet. Alternatively, we could pop up a separate VRML window dynamically generated from the Java simulation.

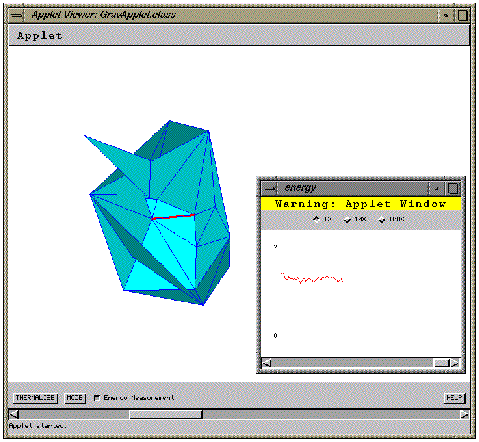
Figure 2: Snapshot of a Java applet running a Monte
Carlo simulation of a 2D fluid membrane. One link is highlighted to
illustrate the link flip that is taking place.
The fluid membrane simulation shown in Fig. 2 allows both node moves as in the crystalline case, and also geometry changes (link flips). The current implementation optionally highlights link flips to help illustrate the simulation process. In this case, the membrane has spherical topology and the speed limiting factor is the image rendering.
The first impression of dynamics in Monte Carlo simulations is good, but it is rather misleading. Monte Carlo dynamics are not real and the individual configurations are not as meaningful as they appear. Instead, one must look at statistics from a representative ensemble of equilibrium configurations. Fig. 2 shows an inset graph of the internal energy of the surface, we are adding simple analysis routines to allow students to calculate mean values and autocorrelation times. Further, for one to extract meaningful data, the system must thermalize for any given set of parameters. This can be particularly problematic around phase transitions, an area of particular interest, where Monte Carlo simulations often take much longer to reach equilibrium. At present we have a button that sets the simulation running without updating the display (hence much faster) for a predetermined number of updates.

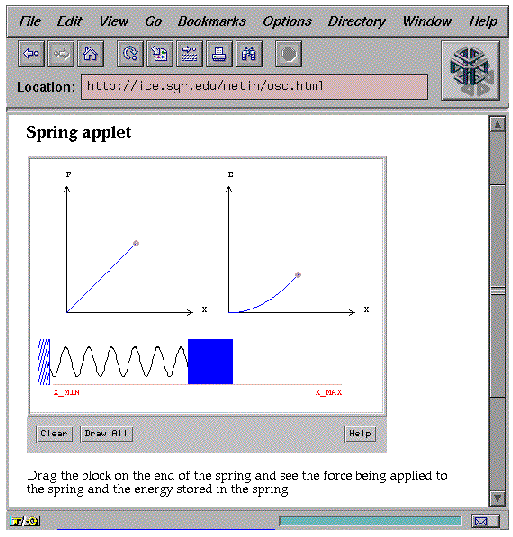
Figure 3: Snapshot of a supporting Java applet
illustrating the properties of a simple spring. The user can move the
end of the spring by dragging the block or one of the graph tracers to
plot the force-extension and energy-extension graphs for a simple spring
obeying Hooke's Law.
In addition to our headline simulations, we intend to develop supporting applets to illustrate principles behind the simulations. For example, some of the membrane simulations are based on ball-and-spring triangulations. We thus have an applet to help students understand springs (Fig. 3). This can then be tailored, along with supporting text, to various levels of understanding. For the younger students, just the idea of increasing force will suffice, whereas we hope to illustrate the importance of stored energy to more advanced students. We have purposefully made the interface very simple with buttons that clear the graphs, draw in the whole graphs, and offer help (including explanation of the other two buttons). The help information appears in a pop-up window.