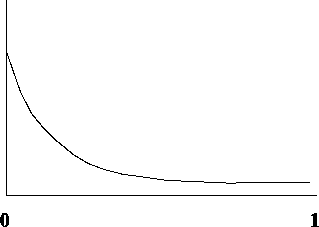
 plots that look like

 are all larger than ones used in calculating
 .
.
 until we
get a nice flat distribution for confidence level C near 1 and
analyze as above.
 plots that look like

 are all larger than ones used in calculating
 .
.
 until we
get a nice flat distribution for confidence level C near 1 and
analyze as above.