Rome Lab Weather Visualization Project
Scott Klasky, Byeongseob Ki, Balaji Natarajan
Project Summary:
There are two aspects of this project. The first aspect is to develop
a system which will allow users to view text and two dimensional graphics
of current weather data, and weather predictions. The second aspect is
to develop a fully collaborative 3D visualization toolkit with the purpose
to examine weather data from supercomputing codes, such as the Oklahoma
Advanced Regional Prediction System (ARPS).
Technology Used in this project:
- A Java front end which will allow users to interactively view current/predicted
weather information.
- Incorporation of Unidata software(UCAR) to allow NPAC computers to
obtain weather data.
- Incorporation of Unidata McIDAS software to analyze the data, and generate
images which will be used by the Java front end.
- Database technology will be used to manage the vasts amount of information
that will be generated by the Unidata software.
- VRML and OpenInventor will be used for the 3D display of the supercomputing
data from weather prediction codes. We are modeling our system in the spirit
of VIS5D.
- We are still examining VRML 2.0 to see if this technology will work.
- We will use API's developed at NPAC to make the 3D visualization system
fully collaborative.
- We are looking into the following areas in this visualization.
- Vector graphics.
- 2D surface and contour plots.
- 3D isosurfaces.
- Volumetric rendering.
- General Filters of 3D data (smoothers, extrapolators, functional transformations,
etc.)
- A Java front end to the 3D visualization system.
Sample pictures
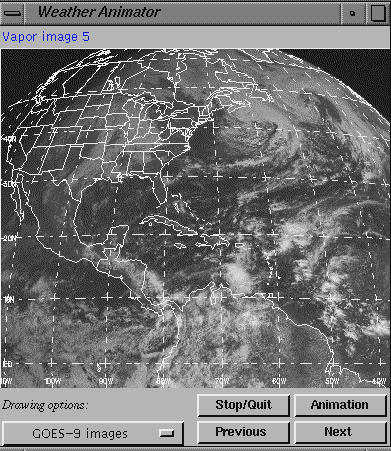
Below is a picture of our weather animator. Here we save
picture files for every hour, and then play them back in this java applet
animator.

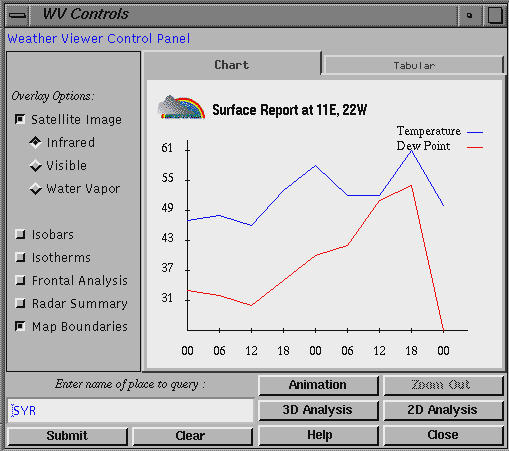
Below is a picture of our Java front end to display weather
information over the Syracuse region.


