|
|
FutureGrid Cloud Metric |
|
|
FutureGrid Cloud Metric |
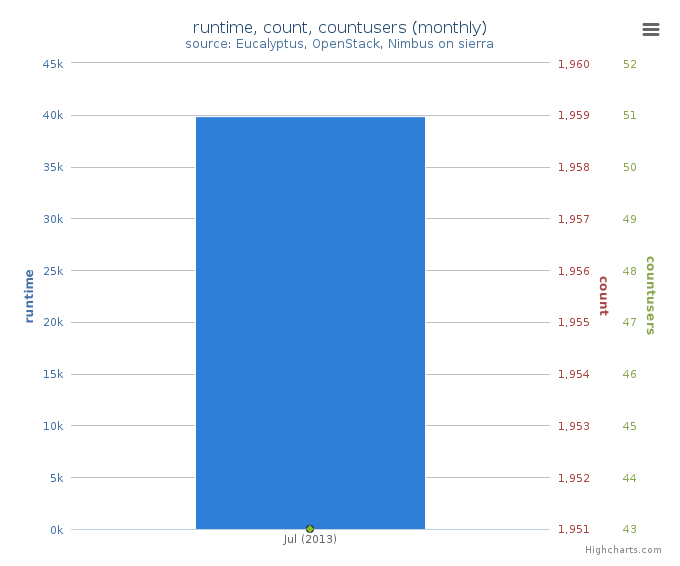
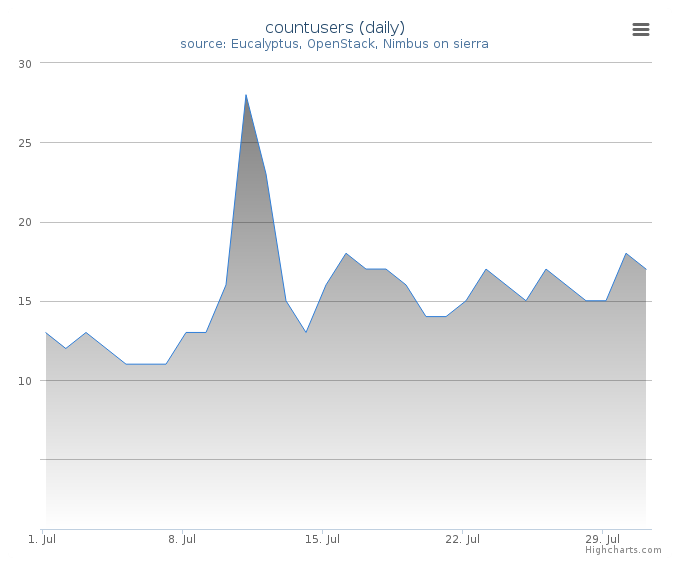
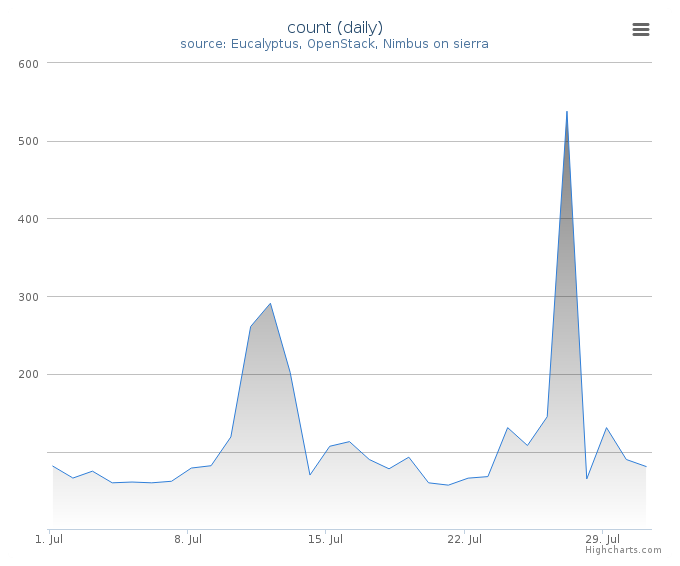
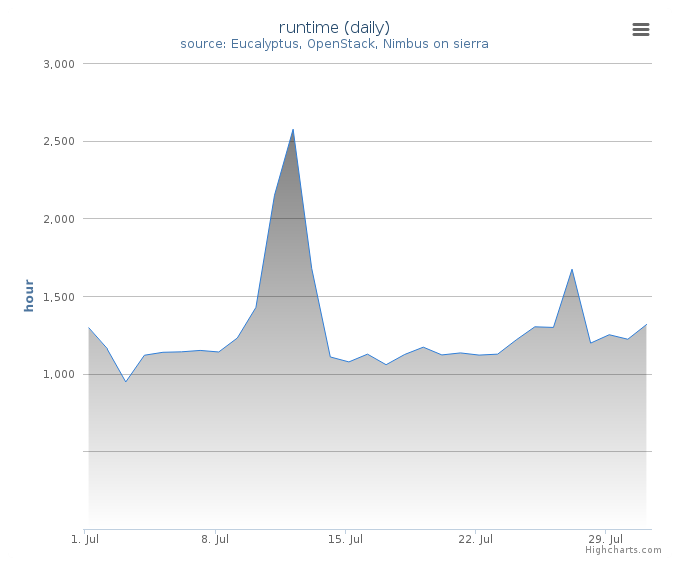
Period: July 01 – July 31, 2013
Cloud(IaaS): nimbus, openstack, eucalyptus
Hostname: sierra
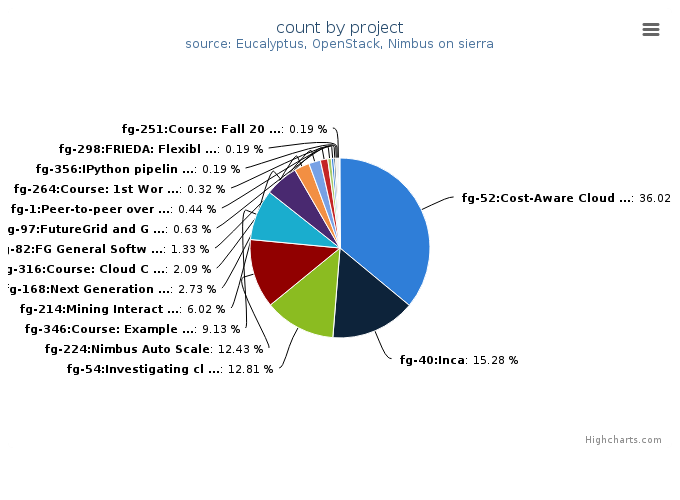
| Project | Value |
|---|---|
| fg-52:Cost-Aware Cloud Computing | 568 |
| fg-40:Inca | 241 |
| fg-54:Investigating cloud computing as a solution for analyzing particle physics data | 202 |
| fg-224:Nimbus Auto Scale | 196 |
| fg-346:Course: Example Course On Advanced Cloud Computing | 144 |
| fg-214:Mining Interactions between Network Community Structure and Information Diffusion | 95 |
| fg-168:Next Generation Sequencing in the Cloud | 43 |
| fg-316:Course: Cloud Computing Class - third edition | 33 |
| fg-82:FG General Software Development | 21 |
| fg-97:FutureGrid and Grid‘5000 Collaboration | 10 |
| fg-1:Peer-to-peer overlay networks and applications in virtual networks and virtual clusters | 7 |
| fg-264:Course: 1st Workshop on bioKepler Tools and Its Applications | 5 |
| fg-356:IPython pipelines for training life sciences researchers on NGS data analysis | 3 |
| fg-298:FRIEDA: Flexible Robust Intelligent Elastic Data Management | 3 |
| fg-251:Course: Fall 2012 B534 Distributed Systems Graduate Course | 3 |
| fg-244:Course: Data Center Scale Computing | 2 |
| fg-314:User-friendly tools to play with cloud platforms | 1 |
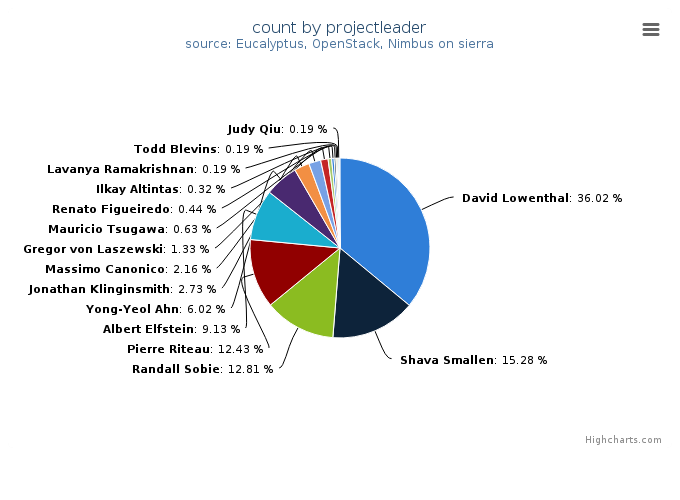
| Projectleader | Value |
|---|---|
| David Lowenthal | 568 |
| Shava Smallen | 241 |
| Randall Sobie | 202 |
| Pierre Riteau | 196 |
| Albert Elfstein | 144 |
| Yong-Yeol Ahn | 95 |
| Jonathan Klinginsmith | 43 |
| Massimo Canonico | 34 |
| Gregor von Laszewski | 21 |
| Mauricio Tsugawa | 10 |
| Renato Figueiredo | 7 |
| Ilkay Altintas | 5 |
| Lavanya Ramakrishnan | 3 |
| Todd Blevins | 3 |
| Judy Qiu | 3 |
| Dirk Grunwald | 2 |
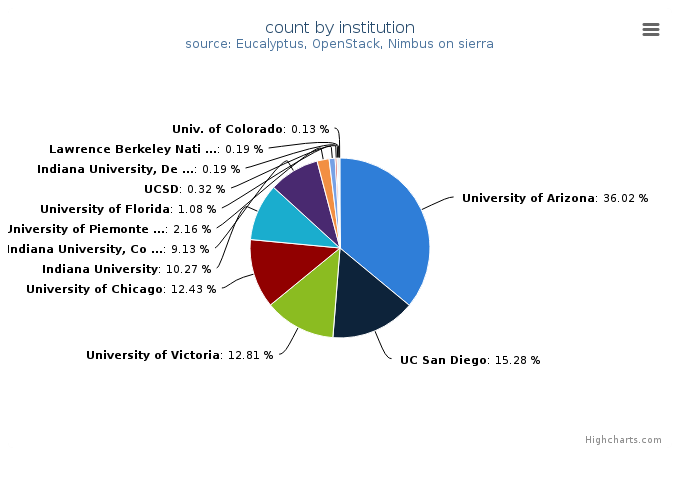
| Institution | Value |
|---|---|
| University of Arizona | 568 |
| UC San Diego | 241 |
| University of Victoria | 202 |
| University of Chicago | 196 |
| Indiana University | 162 |
| Indiana University, Computer Science Department | 144 |
| University of Piemonte Orientale, Computer Science Department | 34 |
| University of Florida | 17 |
| UCSD | 5 |
| Indiana University, Depts of Biology and Molecular and Cellular | 3 |
| Lawrence Berkeley National Lab | 3 |
| Univ. of Colorado | 2 |
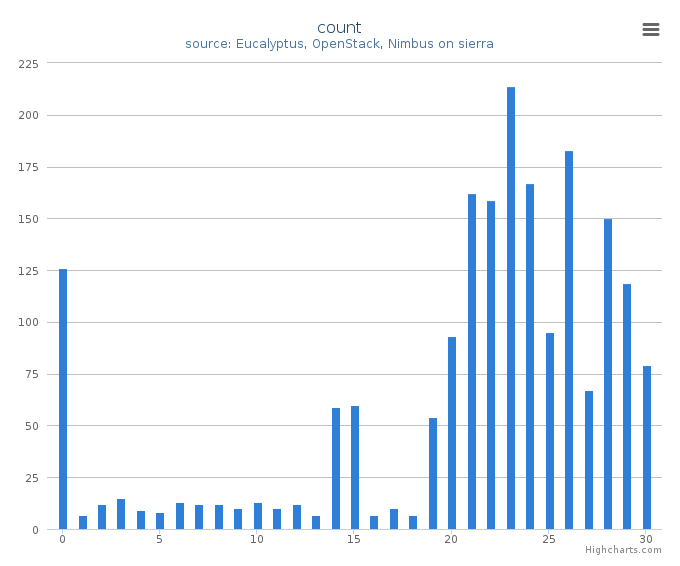
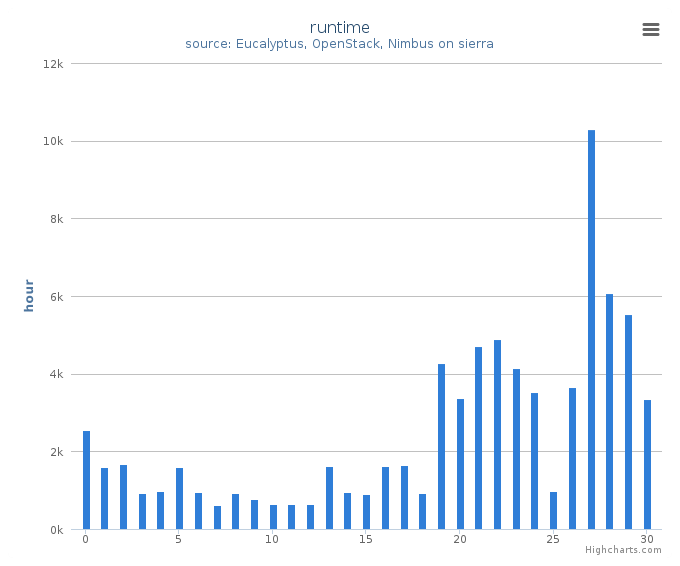
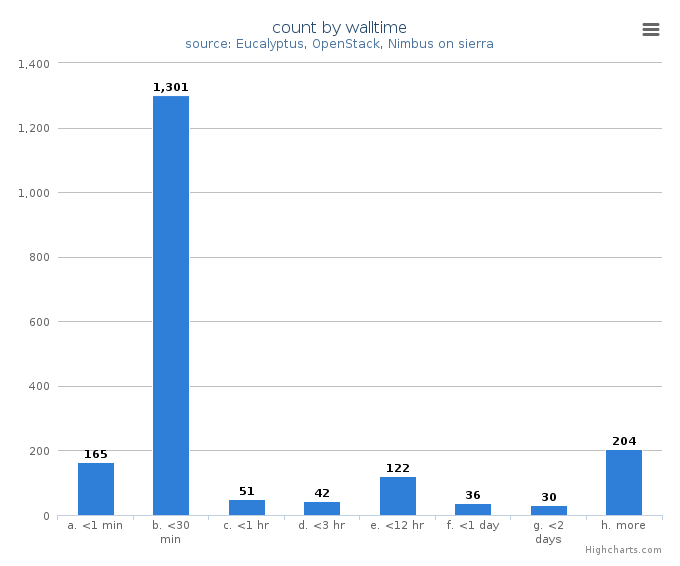
System information shows utilization distribution as to VMs count and wall time. Each cluster represents a compute node.