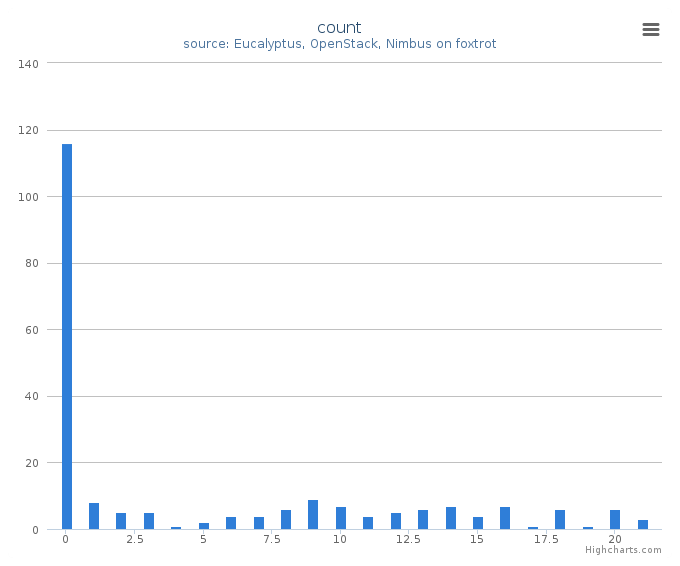
FutureGrid Cloud Metric FutureGrid

Cloud Metric

Table Of Contents

Previous topic

Usage Report alamo

Next topic

August 2013

This Page

Usage Report foxtrot

  • Period: September 01 – September 30, 2013
  • Hostname: foxtrot.futuregrid.org
  • Services: nimbus
  • Metrics: VMs count, Users count, Wall time (hours), Distribution by wall time, project, project leader, and institution, and systems

Histogram

Summary (Monthly)

Average Monthly Usage Data (Wall time, Launched VMs, Users)
Figure 1: Average monthly usage data (wall time (hour), launched VMs, users)
This mixed chart represents average monthly usage as to wall time (hour), the number of VM instances and active users.
  • Period: September 01 – September 30, 2013

  • Cloud(IaaS): nimbus

  • Hostname: foxtrot

  • Metric:
    • Runtime (Wall time hours): Sum of time elapsed from launch to termination of VM instances
    • Count (VM count): The number of launched VM instances
    • User count (Active): The number of users who launched VMs

Summary (Daily)

Users count (daily)
Figure 2: Users count
This time series chart represents daily active user count for cloud services and shows historical changes during the period.
  • Period: September 01 – September 30, 2013
  • Cloud(IaaS): nimbus
  • Hostname: foxtrot
VMs count (daily)
Figure 3: VMs count
This time series chart represents the number of daily launched VM instances for cloud services and shows historical changes during the period.
  • Period: September 01 – September 30, 2013
  • Cloud(IaaS): nimbus
  • Hostname: foxtrot
Wall time (hours, daily)
Figure 4: Wall time (hours)
This time series chart represents daily wall time (hours) for cloud services and shows historical changes during the period.
  • Period: September 01 – September 30, 2013
  • Cloud(IaaS): nimbus
  • Hostname: foxtrot

Distribution

VM count by wall time
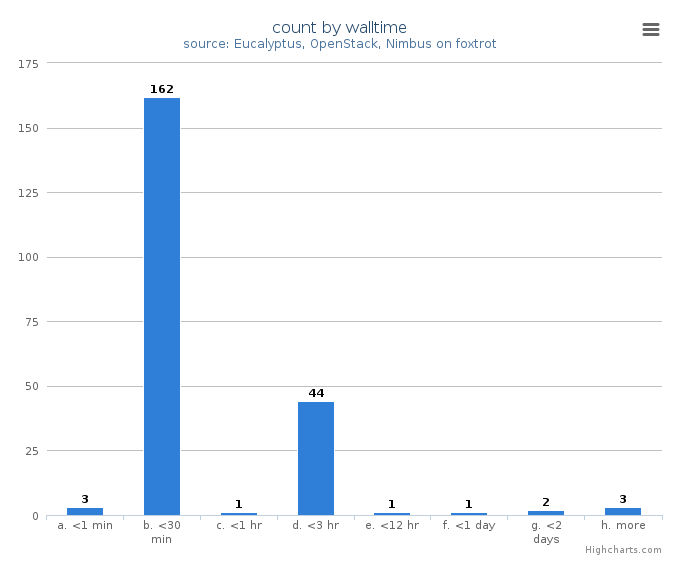
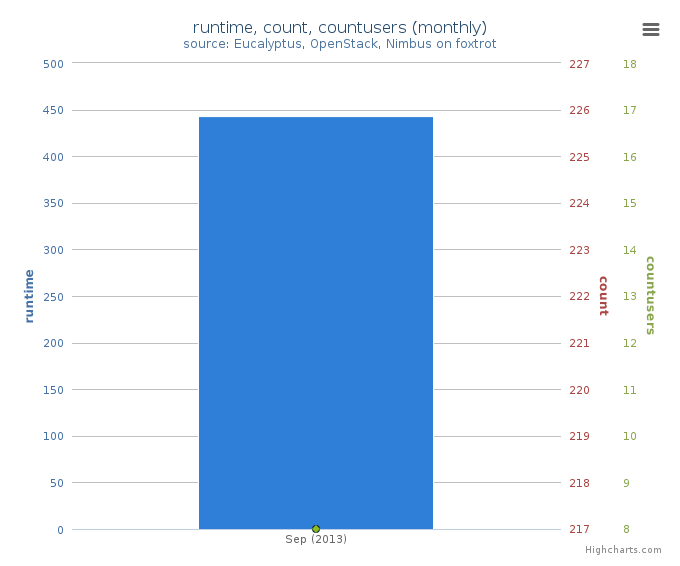
Figure 5: VM count by wall time
This chart illustrates usage patterns of VM instances in terms of running wall time.
  • Period: September 01 – September 30, 2013
  • Cloud(IaaS): nimbus
  • Hostname: foxtrot
VMs count by project
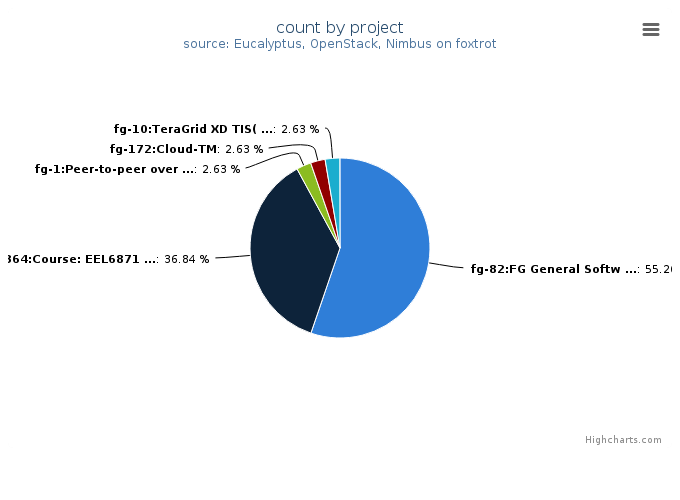
Figure 6: VMs count by project
This chart illustrates the proportion of launched VM instances by project groups. The same data in tabular form follows.
  • Period: September 01 – September 30, 2013
  • Cloud(IaaS): nimbus
  • Hostname: foxtrot
VMs count by project
Project Value
fg-82:FG General Software Development 21
fg-364:Course: EEL6871 Autonomic Computing 14
fg-1:Peer-to-peer overlay networks and applications in virtual networks and virtual clusters 1
fg-172:Cloud-TM 1
fg-10:TeraGrid XD TIS(Technology Insertion Service) Technology Evaluation Laboratory 1
VMs count by project leader
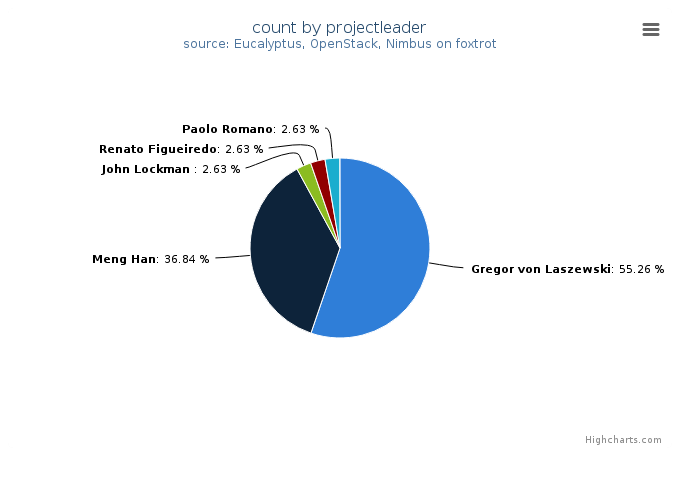
Figure 7: VMs count by project leader
This chart also illustrates the proportion of launched VM instances by project Leader. The same data in tabular form follows.
  • Period: September 01 – September 30, 2013
  • Cloud(IaaS): nimbus
  • Hostname: foxtrot
VMs count by project leader
Projectleader Value
Gregor von Laszewski 21
Meng Han 14
John Lockman 1
Renato Figueiredo 1
Paolo Romano 1
VMs count by institution
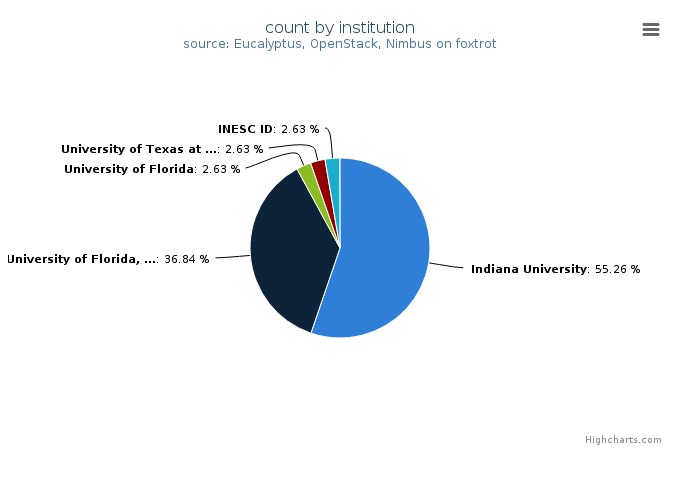
Figure 8: VMs count by institution
This chart illustrates the proportion of launched VM instances by Institution. The same data in tabular form follows.
  • Period: September 01 – September 30, 2013
  • Cloud(IaaS): nimbus
  • Hostname: foxtrot
VMs count by institution
Institution Value
Indiana University 21
University of Florida, ACIS 14
University of Florida 1
University of Texas at Austin 1
INESC ID 1
Wall time (hours) by project leader
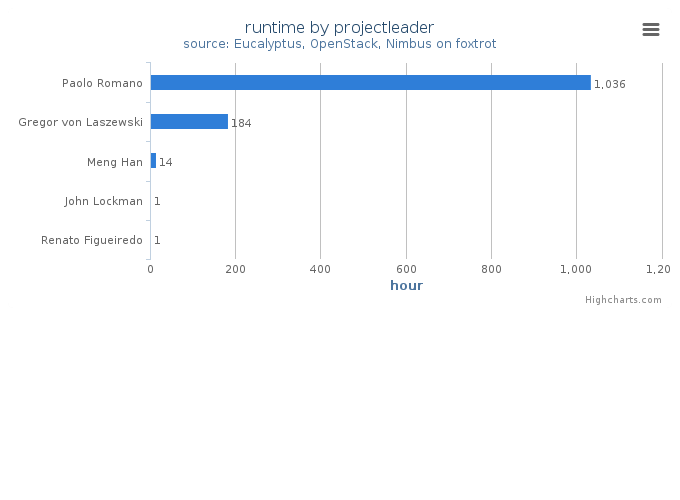
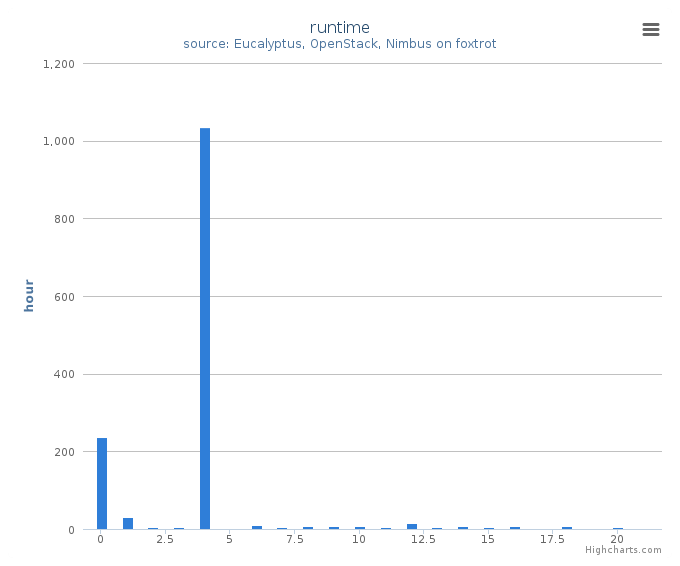
Figure 9: Wall time (hours) by project leader
This chart illustrates proportionate total run times by project leader.
  • Period: September 01 – September 30, 2013
  • Cloud(IaaS): nimbus
  • Hostname: foxtrot

System information

System information shows utilization distribution as to VMs count and wall time. Each cluster represents a compute node.

VMs count by systems in Cluster (foxtrot)
Figure 10: VMs count by systems (compute nodes) in Cluster (foxtrot)
This column chart represents VMs count among systems.
  • Period: September 01 – September 30, 2013
  • Cloud(IaaS): nimbus
  • Hostname: foxtrot
Wall time (hours) by systems in Cluster (foxtrot)
Figure 11: Wall time (hours) by systems (compute nodes) in Cluster (foxtrot)
This column chart represents wall time among systems.
  • Period: September 01 – September 30, 2013
  • Cloud(IaaS): nimbus
  • Hostname: foxtrot