|
|
FutureGrid Cloud Metric |
|
|
FutureGrid Cloud Metric |
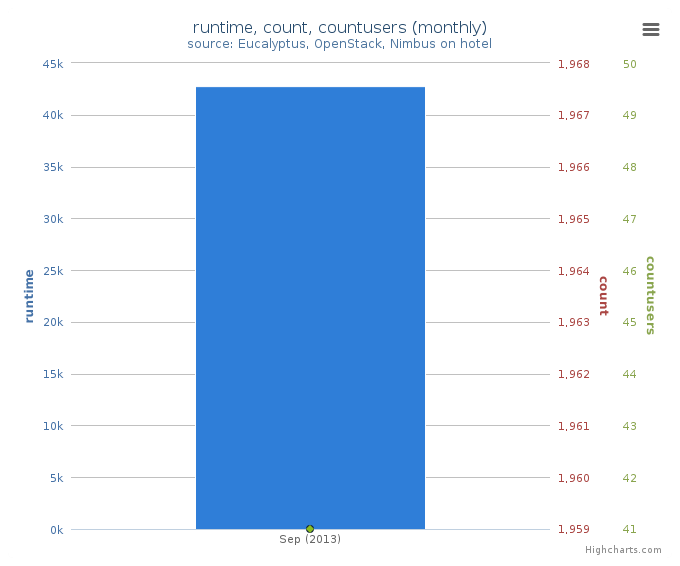
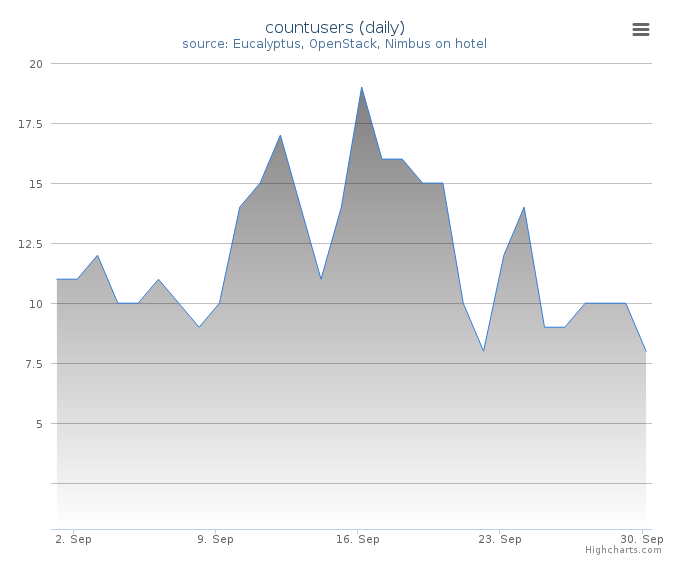
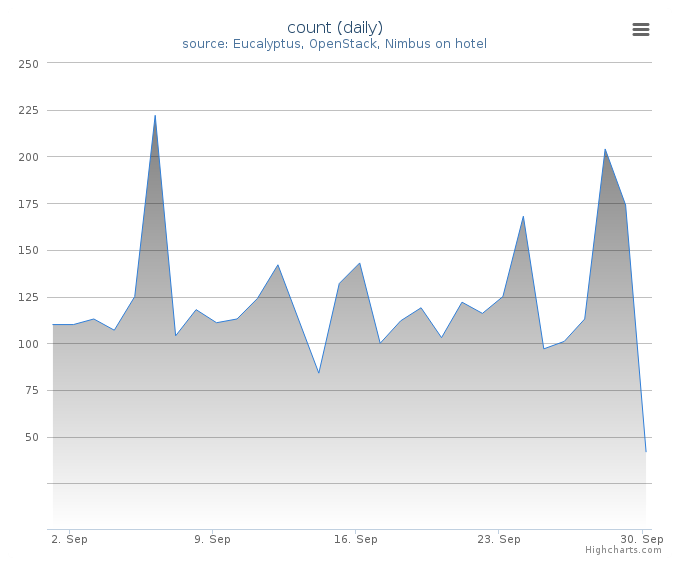
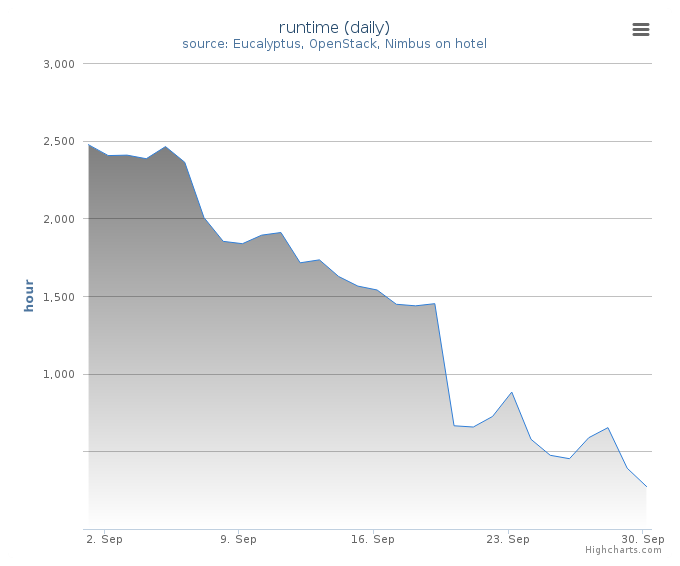
Period: September 01 – September 30, 2013
Cloud(IaaS): nimbus
Hostname: hotel
| Project | Value |
|---|---|
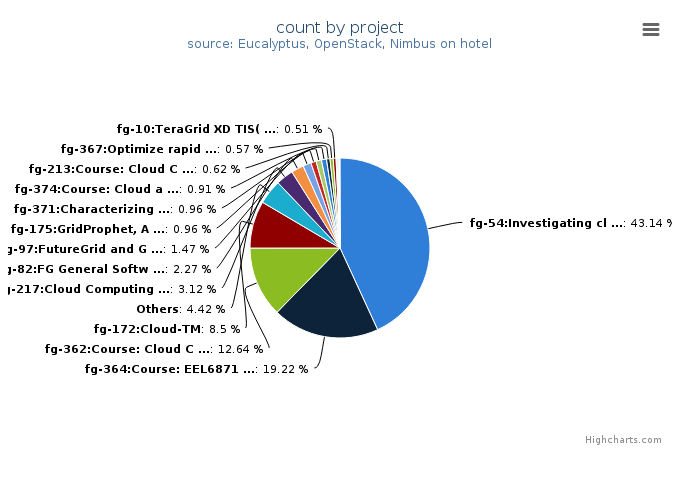
| fg-54:Investigating cloud computing as a solution for analyzing particle physics data | 761 |
| fg-364:Course: EEL6871 Autonomic Computing | 339 |
| fg-362:Course: Cloud Computing and Storage (UF) | 223 |
| fg-172:Cloud-TM | 150 |
| Others | 78 |
| fg-217:Cloud Computing In Education | 55 |
| fg-82:FG General Software Development | 40 |
| fg-97:FutureGrid and Grid‘5000 Collaboration | 26 |
| fg-175:GridProphet, A workflow execution time prediction system for the Grid | 17 |
| fg-371:Characterizing Infrastructure Cloud Performance for Scientific Computing | 17 |
| fg-374:Course: Cloud and Distributed Computing | 16 |
| fg-213:Course: Cloud Computing class - second edition | 11 |
| fg-367:Optimize rapid deployment and updating of VM images at the remote compute cluster | 10 |
| fg-10:TeraGrid XD TIS(Technology Insertion Service) Technology Evaluation Laboratory | 9 |
| fg-150:SC11: Using and Building Infrastructure Clouds for Science | 3 |
| fg-130:Optimizing Scientific Workflows on Clouds | 3 |
| fg-136:JGC-DataCloud-2012 paper experiments | 3 |
| fg-1:Peer-to-peer overlay networks and applications in virtual networks and virtual clusters | 2 |
| fg-355:Course: Data Center Scale Computing Class | 1 |
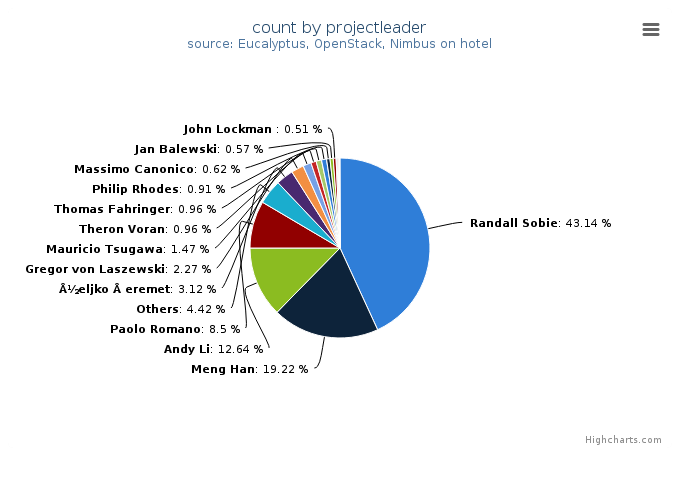
| Projectleader | Value |
|---|---|
| Randall Sobie | 761 |
| Meng Han | 339 |
| Andy Li | 223 |
| Paolo Romano | 150 |
| Others | 78 |
| Željko Šeremet | 55 |
| Gregor von Laszewski | 40 |
| Mauricio Tsugawa | 26 |
| Theron Voran | 17 |
| Thomas Fahringer | 17 |
| Philip Rhodes | 16 |
| Massimo Canonico | 11 |
| Jan Balewski | 10 |
| John Lockman | 9 |
| Mats Rynge | 3 |
| Weiwei Chen | 3 |
| John Bresnahan | 3 |
| Renato Figueiredo | 2 |
| Dirk Grunwald | 1 |
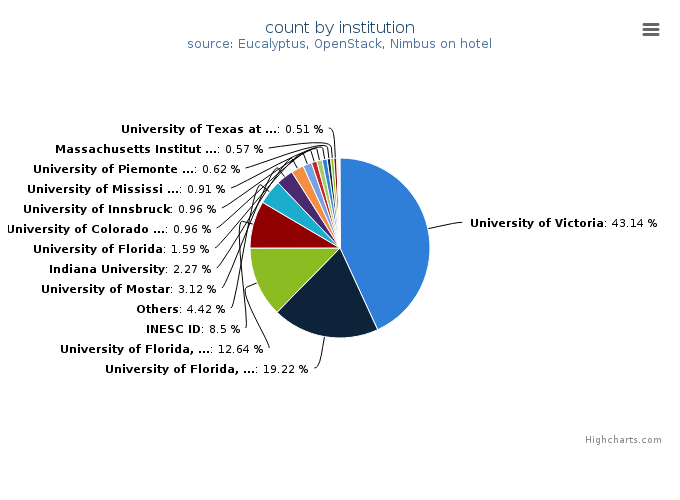
| Institution | Value |
|---|---|
| University of Victoria | 761 |
| University of Florida, ACIS | 339 |
| University of Florida, Department of Electrical and Computer Eng | 223 |
| INESC ID | 150 |
| Others | 78 |
| University of Mostar | 55 |
| Indiana University | 40 |
| University of Florida | 28 |
| University of Colorado at Boulder, Computer Science Department | 17 |
| University of Innsbruck | 17 |
| University of Mississippi, Department of Computer Science | 16 |
| University of Piemonte Orientale | 11 |
| Massachusetts Institute of Technology, Laboratory for Nuclear Sc | 10 |
| University of Texas at Austin | 9 |
| USC | 3 |
| Nimbus | 3 |
| University of Southern California | 3 |
| Univ. of Colorado, Boulder, Computer Science | 1 |
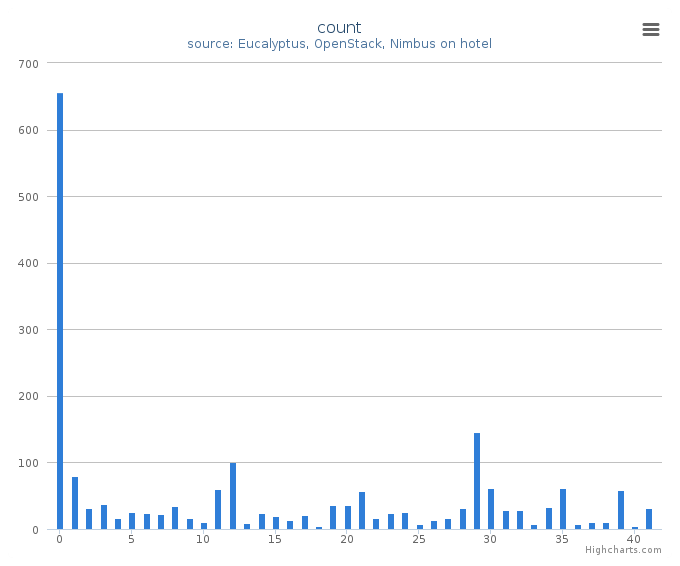
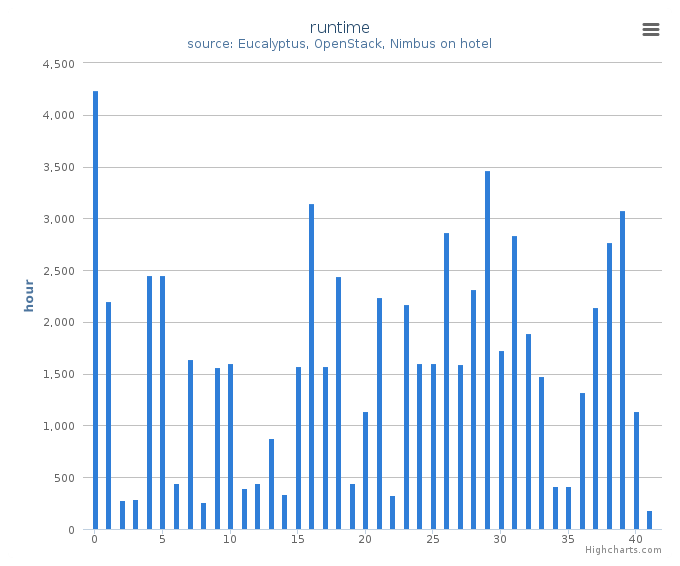
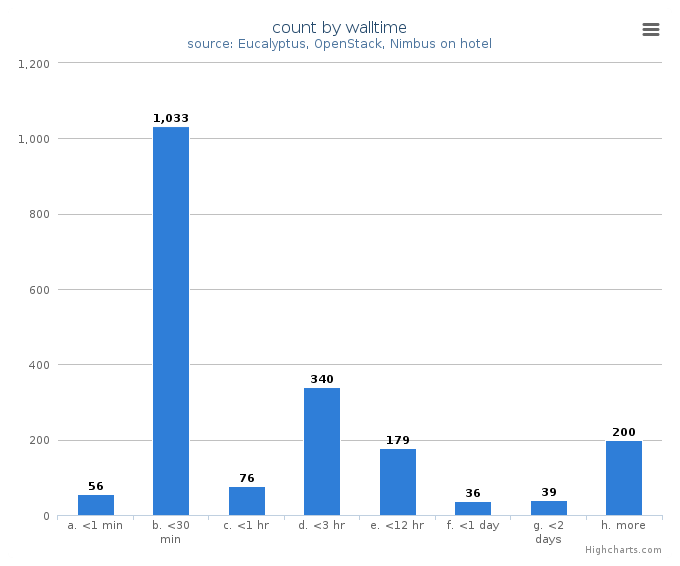
System information shows utilization distribution as to VMs count and wall time. Each cluster represents a compute node.