|
|
FutureGrid Cloud Metric |
|
|
FutureGrid Cloud Metric |
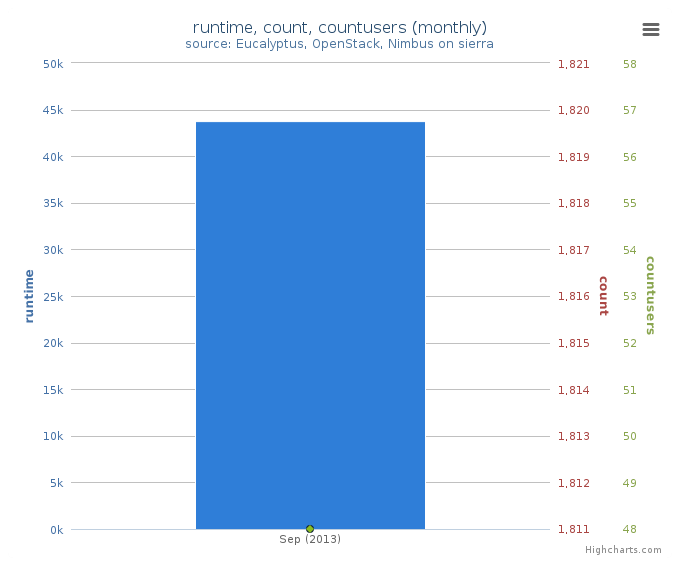
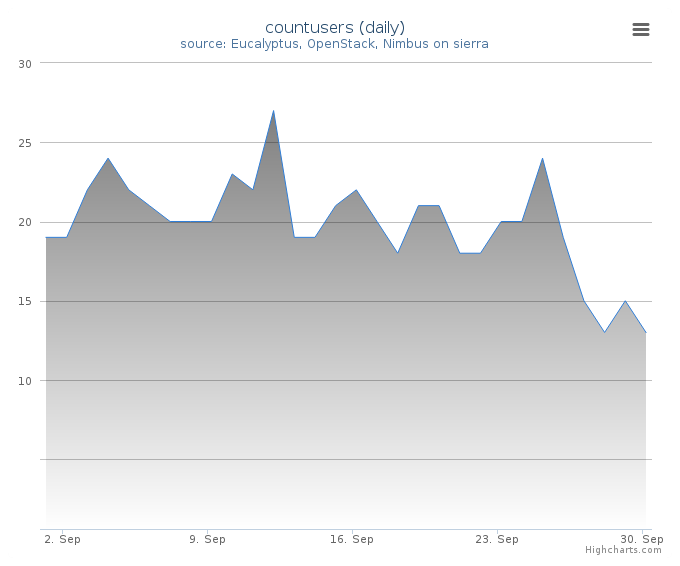
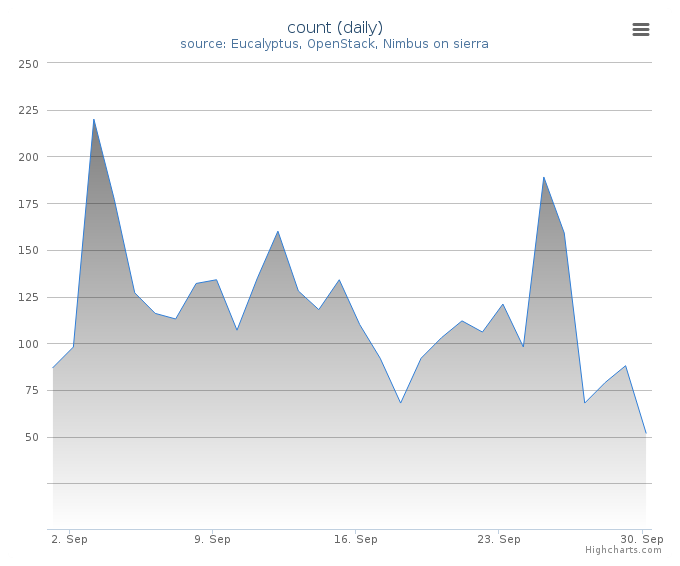
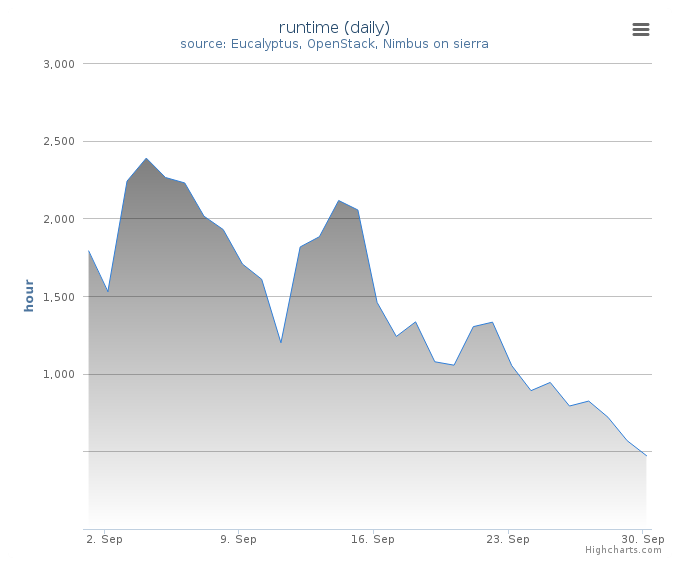
Period: September 01 – September 30, 2013
Cloud(IaaS): nimbus, openstack, eucalyptus
Hostname: sierra
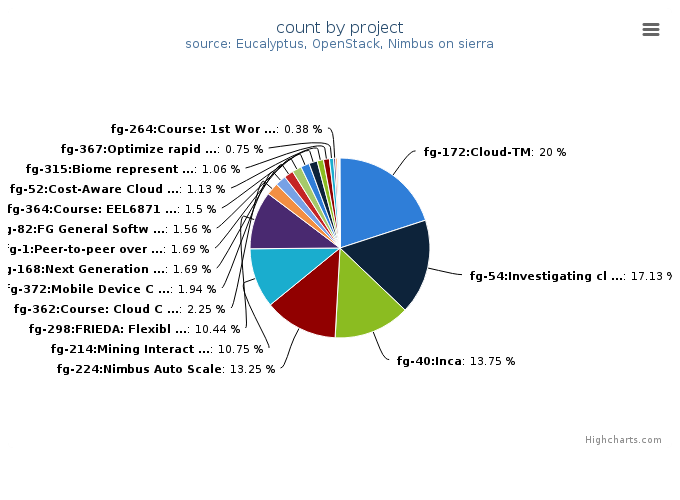
| Project | Value |
|---|---|
| fg-172:Cloud-TM | 320 |
| fg-54:Investigating cloud computing as a solution for analyzing particle physics data | 274 |
| fg-40:Inca | 220 |
| fg-224:Nimbus Auto Scale | 212 |
| fg-214:Mining Interactions between Network Community Structure and Information Diffusion | 172 |
| fg-298:FRIEDA: Flexible Robust Intelligent Elastic Data Management | 167 |
| fg-362:Course: Cloud Computing and Storage (UF) | 36 |
| fg-372:Mobile Device Computation Offloading over SocialVPNs | 31 |
| fg-168:Next Generation Sequencing in the Cloud | 27 |
| fg-1:Peer-to-peer overlay networks and applications in virtual networks and virtual clusters | 27 |
| fg-82:FG General Software Development | 25 |
| fg-364:Course: EEL6871 Autonomic Computing | 24 |
| fg-52:Cost-Aware Cloud Computing | 18 |
| fg-315:Biome representational in silico karyotyping | 17 |
| fg-367:Optimize rapid deployment and updating of VM images at the remote compute cluster | 12 |
| fg-264:Course: 1st Workshop on bioKepler Tools and Its Applications | 6 |
| fg-97:FutureGrid and Grid‘5000 Collaboration | 5 |
| fg-374:Course: Cloud and Distributed Computing | 4 |
| fg-244:Course: Data Center Scale Computing | 1 |
| fg-69:Investigate provenance collection for MapReduce | 1 |
| fg-355:Course: Data Center Scale Computing Class | 1 |
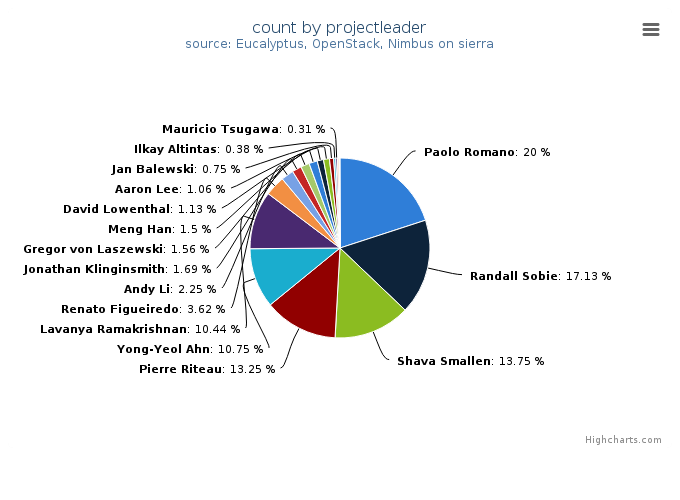
| Projectleader | Value |
|---|---|
| Paolo Romano | 320 |
| Randall Sobie | 274 |
| Shava Smallen | 220 |
| Pierre Riteau | 212 |
| Yong-Yeol Ahn | 172 |
| Lavanya Ramakrishnan | 167 |
| Renato Figueiredo | 58 |
| Andy Li | 36 |
| Jonathan Klinginsmith | 27 |
| Gregor von Laszewski | 25 |
| Meng Han | 24 |
| David Lowenthal | 18 |
| Aaron Lee | 17 |
| Jan Balewski | 12 |
| Ilkay Altintas | 6 |
| Mauricio Tsugawa | 5 |
| Philip Rhodes | 4 |
| Dirk Grunwald | 2 |
| Jiaan Zeng | 1 |
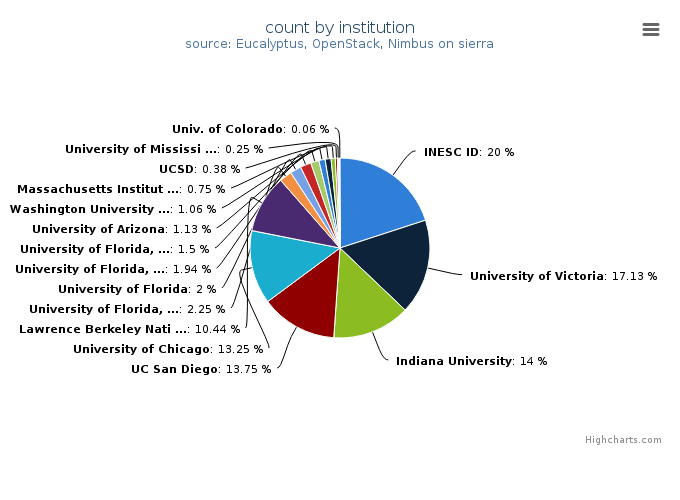
| Institution | Value |
|---|---|
| INESC ID | 320 |
| University of Victoria | 274 |
| Indiana University | 224 |
| UC San Diego | 220 |
| University of Chicago | 212 |
| Lawrence Berkeley National Lab | 167 |
| University of Florida, Department of Electrical and Computer Eng | 36 |
| University of Florida | 32 |
| University of Florida, Electrical and Computer Engineering | 31 |
| University of Florida, ACIS | 24 |
| University of Arizona | 18 |
| Washington University at St Louis, School of Medicine, Departmen | 17 |
| Massachusetts Institute of Technology, Laboratory for Nuclear Sc | 12 |
| UCSD | 6 |
| University of Mississippi, Department of Computer Science | 4 |
| Univ. of Colorado, Boulder, Computer Science | 1 |
| Computer Science | 1 |
| Univ. of Colorado | 1 |
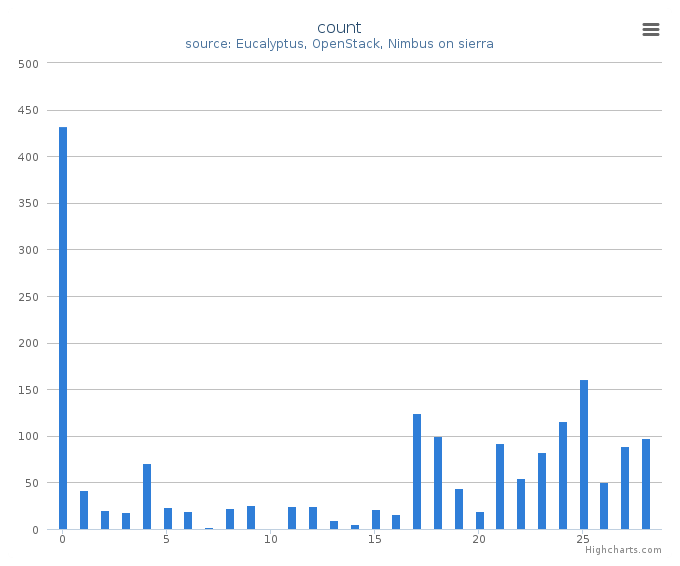
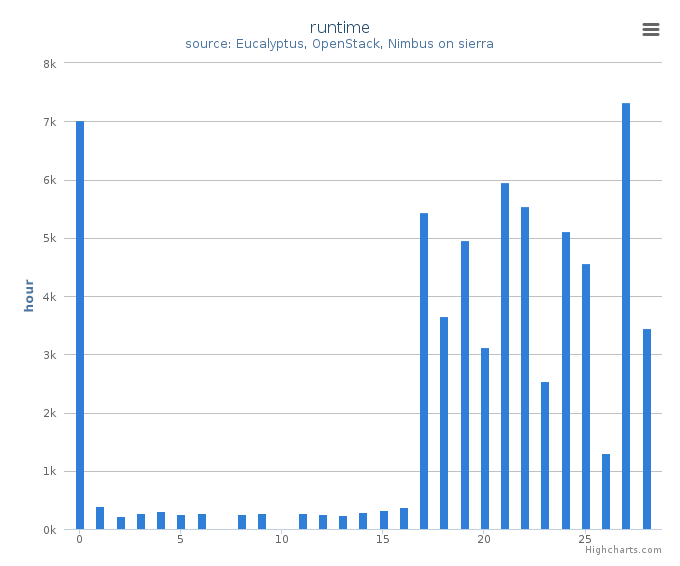
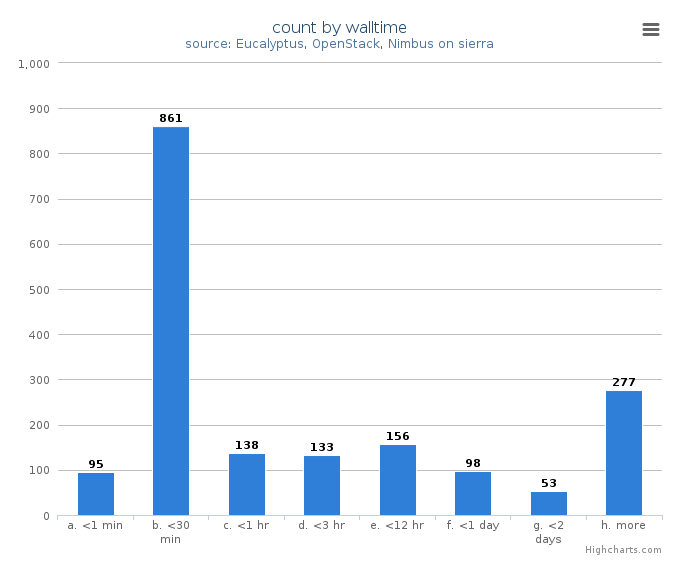
System information shows utilization distribution as to VMs count and wall time. Each cluster represents a compute node.