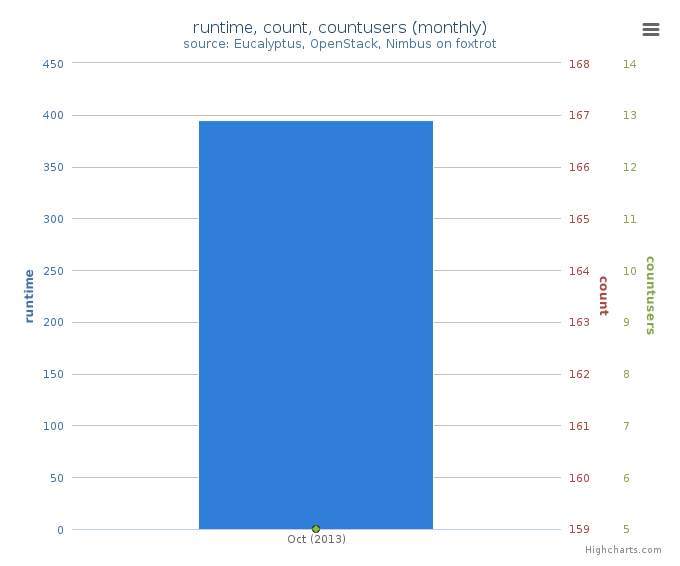
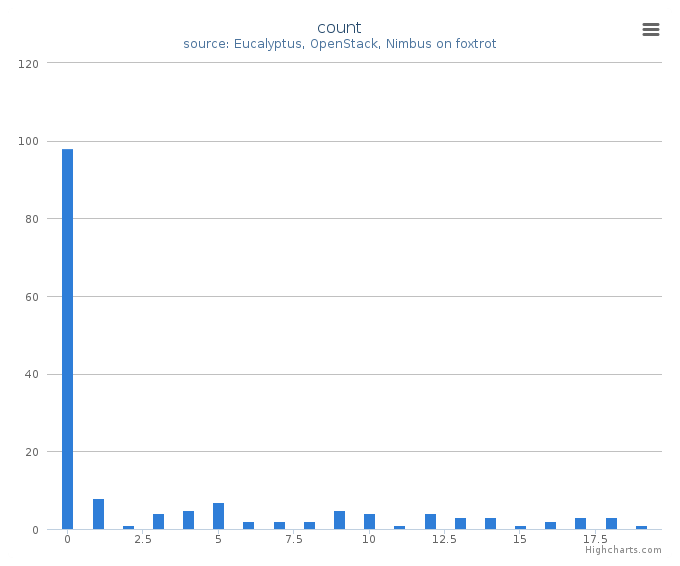
Distribution
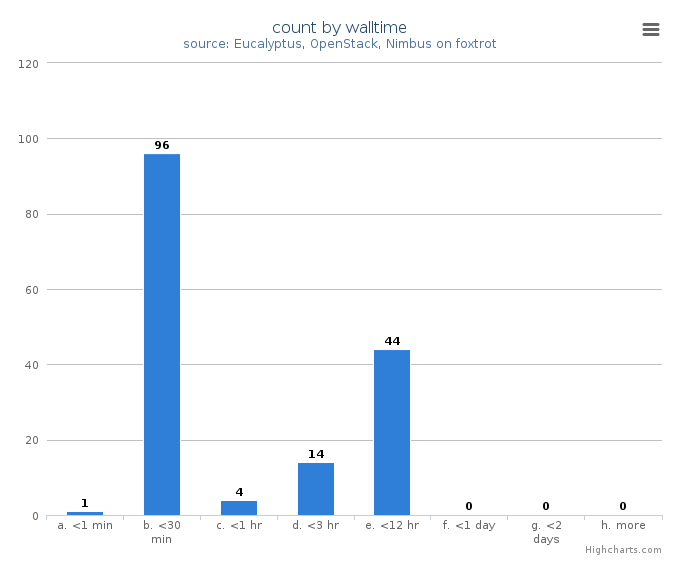
Figure 5: VM count by wall time
This chart illustrates usage patterns of VM instances in terms of running wall time.
- Period: October 01 – October 31, 2013
- Cloud(IaaS): nimbus
- Hostname: foxtrot
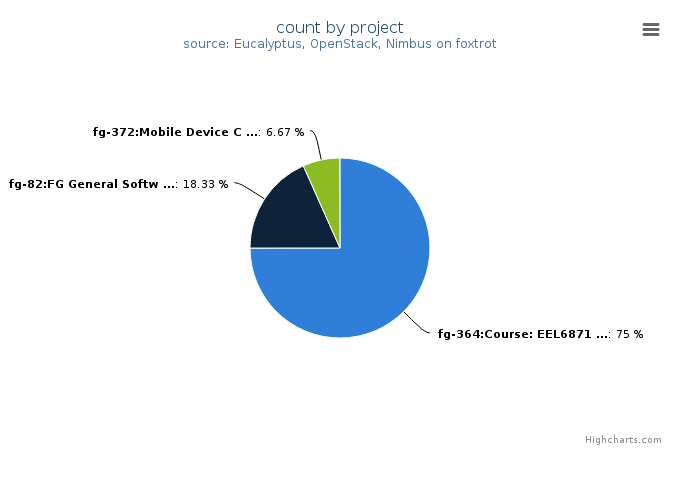
Figure 6: VMs count by project
This chart illustrates the proportion of launched VM instances by project groups. The same data in tabular form follows.
- Period: October 01 – October 31, 2013
- Cloud(IaaS): nimbus
- Hostname: foxtrot
VMs count by project
| Project |
Value |
|---|
| fg-364:Course: EEL6871 Autonomic Computing |
45 |
| fg-82:FG General Software Development |
11 |
| fg-372:Mobile Device Computation Offloading over SocialVPNs |
4 |
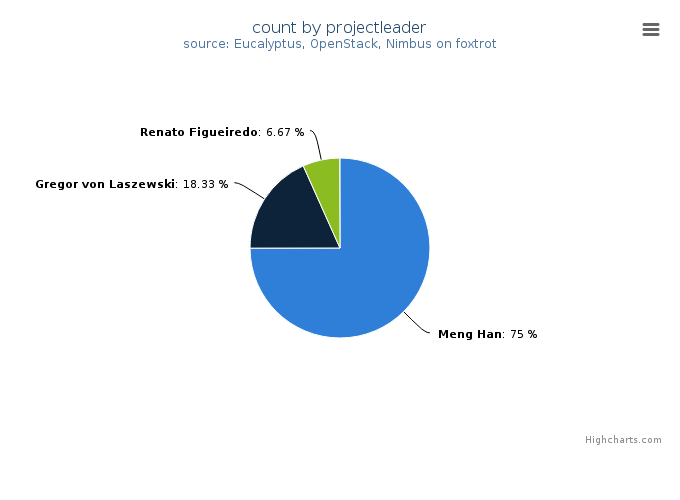
Figure 7: VMs count by project leader
This chart also illustrates the proportion of launched VM instances by project Leader. The same data in tabular form follows.
- Period: October 01 – October 31, 2013
- Cloud(IaaS): nimbus
- Hostname: foxtrot
VMs count by project leader
| Projectleader |
Value |
|---|
| Meng Han |
45 |
| Gregor von Laszewski |
11 |
| Renato Figueiredo |
4 |

Figure 8: VMs count by institution
This chart illustrates the proportion of launched VM instances by Institution. The same data in tabular form follows.
- Period: October 01 – October 31, 2013
- Cloud(IaaS): nimbus
- Hostname: foxtrot
VMs count by institution
| Institution |
Value |
|---|
| University of Florida, ACIS |
45 |
| Indiana University |
11 |
| University of Florida, Electrical and Computer Engineering |
4 |
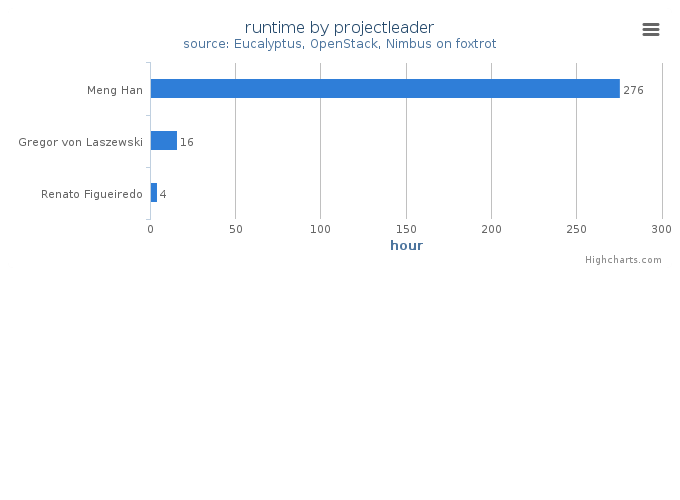
Figure 9: Wall time (hours) by project leader
This chart illustrates proportionate total run times by project leader.
- Period: October 01 – October 31, 2013
- Cloud(IaaS): nimbus
- Hostname: foxtrot