|
|
FutureGrid Cloud Metric |
|
|
FutureGrid Cloud Metric |
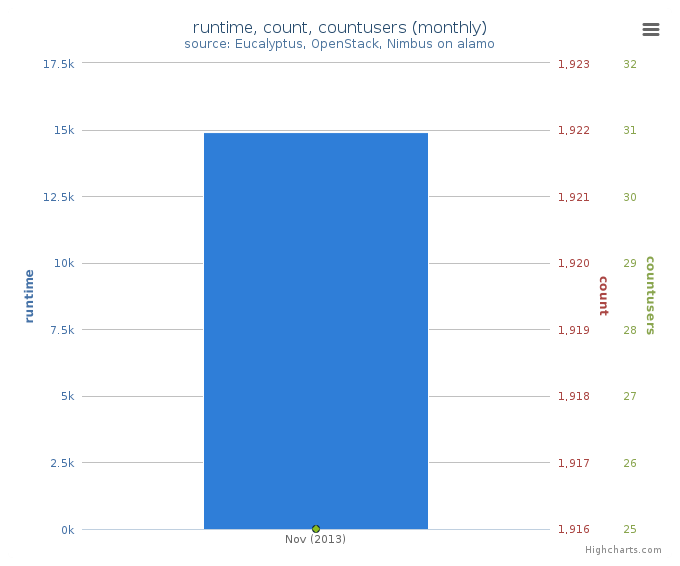
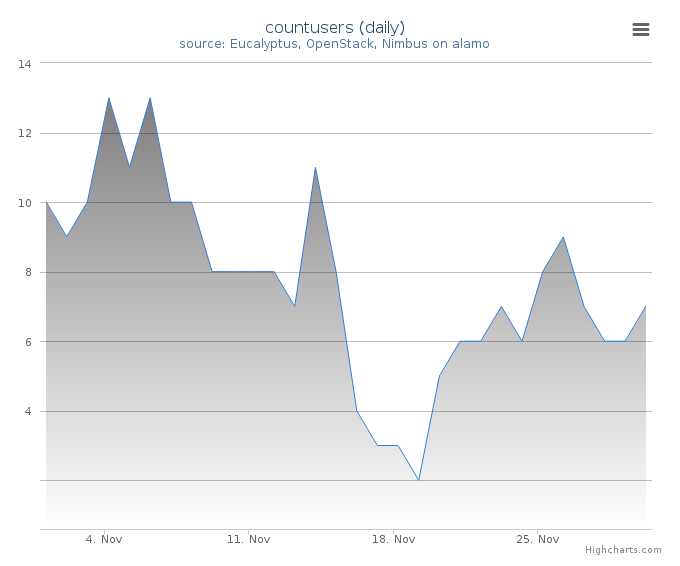
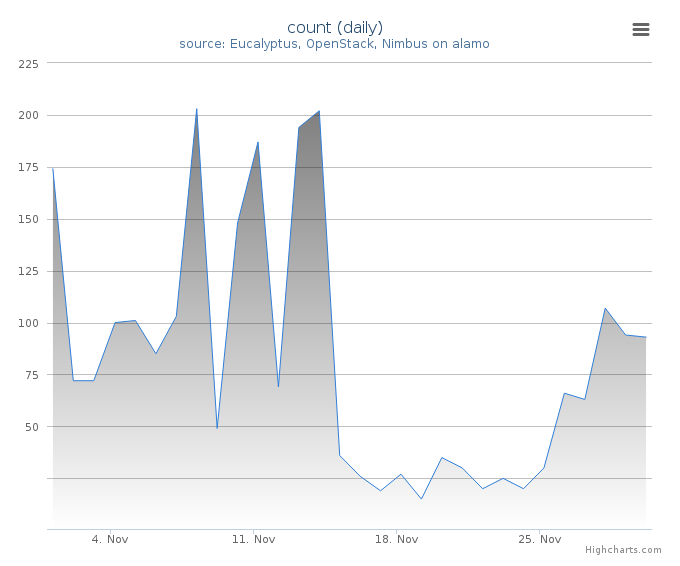
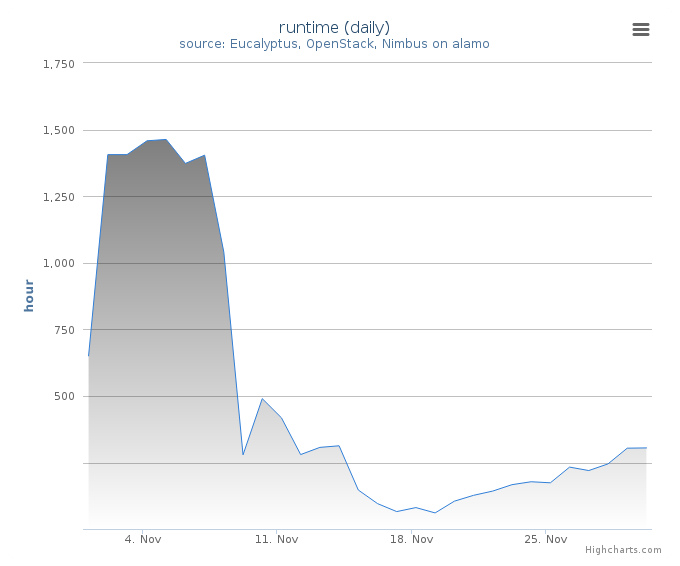
Period: November 01 – November 30, 2013
Cloud(IaaS): nimbus, openstack
Hostname: alamo
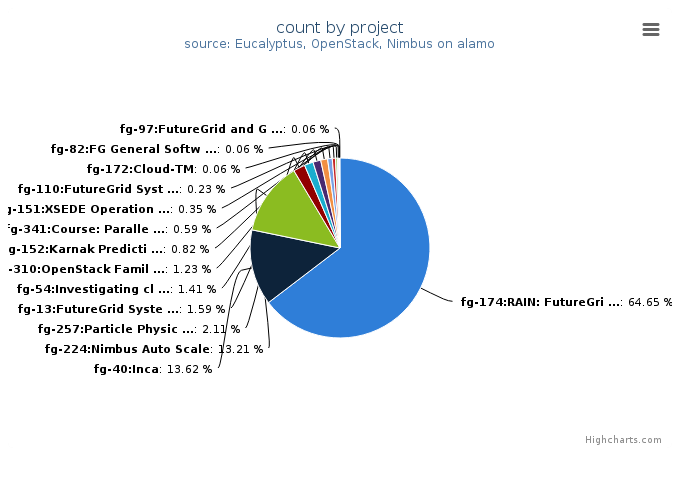
| Project | Value |
|---|---|
| fg-174:RAIN: FutureGrid Dynamic provisioning Framework | 1101 |
| fg-40:Inca | 232 |
| fg-224:Nimbus Auto Scale | 225 |
| fg-257:Particle Physics Data analysis cluster for ATLAS LHC experiment | 36 |
| fg-13:FutureGrid Systems Development and Prototyping | 27 |
| fg-54:Investigating cloud computing as a solution for analyzing particle physics data | 24 |
| fg-310:OpenStack Familiarization for TACC | 21 |
| fg-152:Karnak Prediction Service | 14 |
| fg-341:Course: Parallel Computing | 10 |
| fg-151:XSEDE Operations Group | 6 |
| fg-110:FutureGrid Systems Development | 4 |
| fg-172:Cloud-TM | 1 |
| fg-82:FG General Software Development | 1 |
| fg-97:FutureGrid and Grid‘5000 Collaboration | 1 |
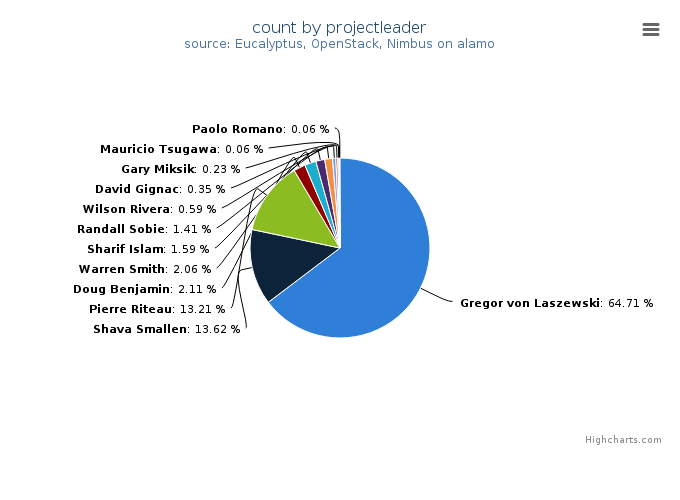
| Projectleader | Value |
|---|---|
| Gregor von Laszewski | 1102 |
| Shava Smallen | 232 |
| Pierre Riteau | 225 |
| Doug Benjamin | 36 |
| Warren Smith | 35 |
| Sharif Islam | 27 |
| Randall Sobie | 24 |
| Wilson Rivera | 10 |
| David Gignac | 6 |
| Gary Miksik | 4 |
| Mauricio Tsugawa | 1 |
| Paolo Romano | 1 |
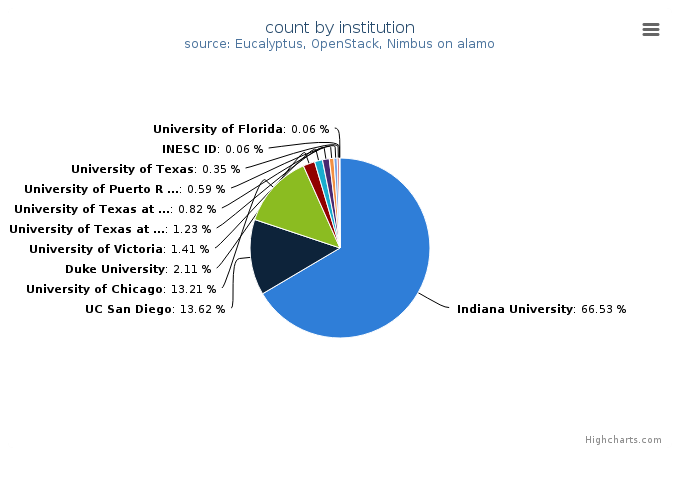
| Institution | Value |
|---|---|
| Indiana University | 1133 |
| UC San Diego | 232 |
| University of Chicago | 225 |
| Duke University | 36 |
| University of Victoria | 24 |
| University of Texas at Austin, Texas Advanced Computing Center | 21 |
| University of Texas at Austin | 14 |
| University of Puerto Rico, Electrical and Computer Emgineering D | 10 |
| University of Texas | 6 |
| INESC ID | 1 |
| University of Florida | 1 |
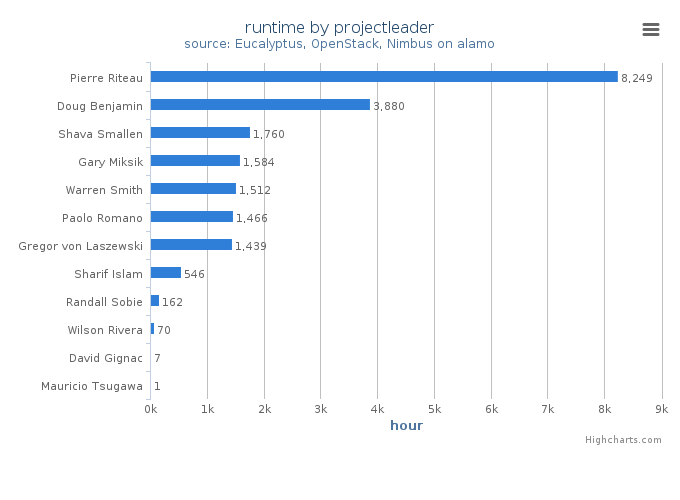
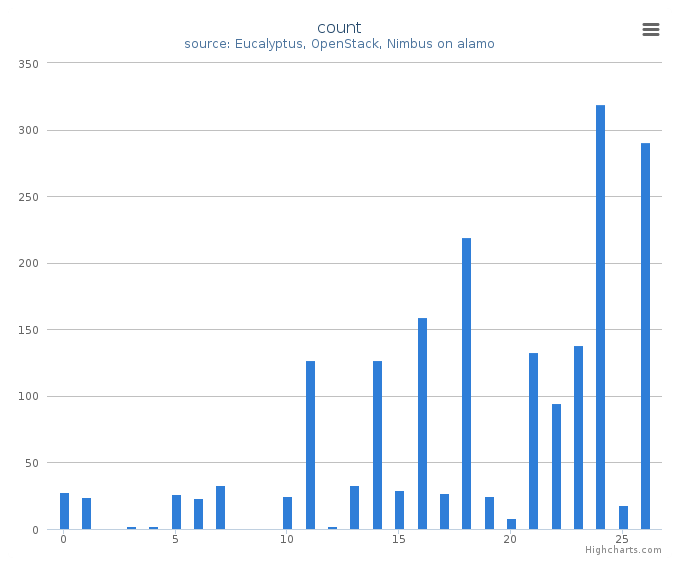
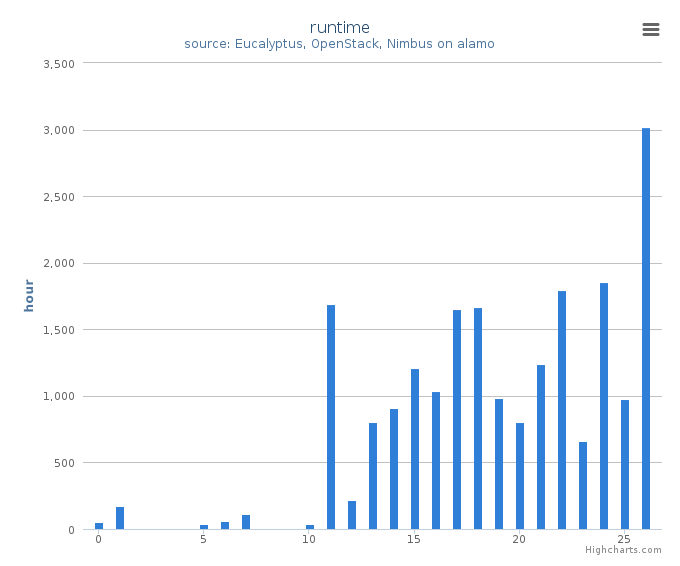
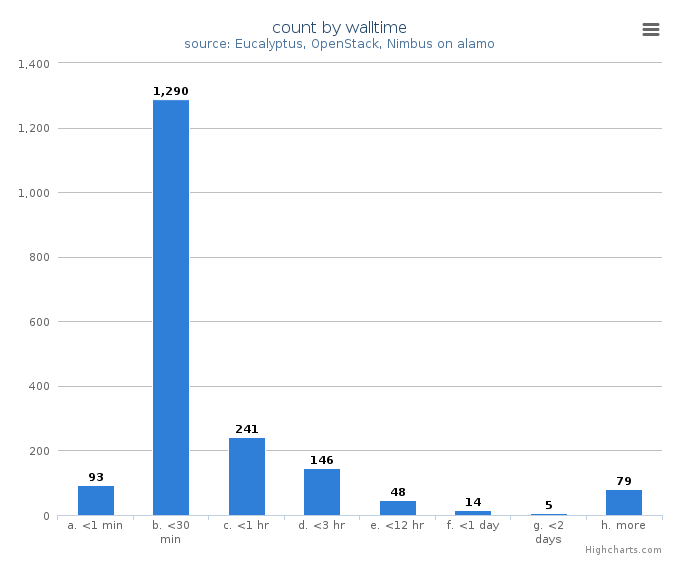
System information shows utilization distribution as to VMs count and wall time. Each cluster represents a compute node.