|
|
FutureGrid Cloud Metric |
|
|
FutureGrid Cloud Metric |
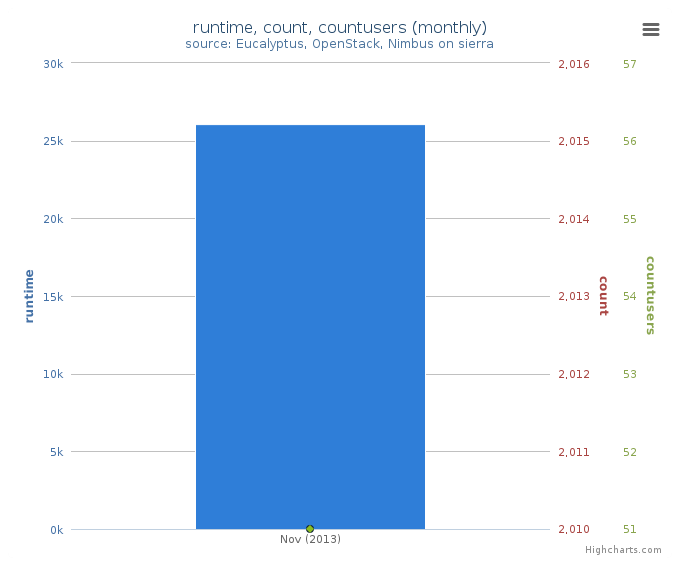
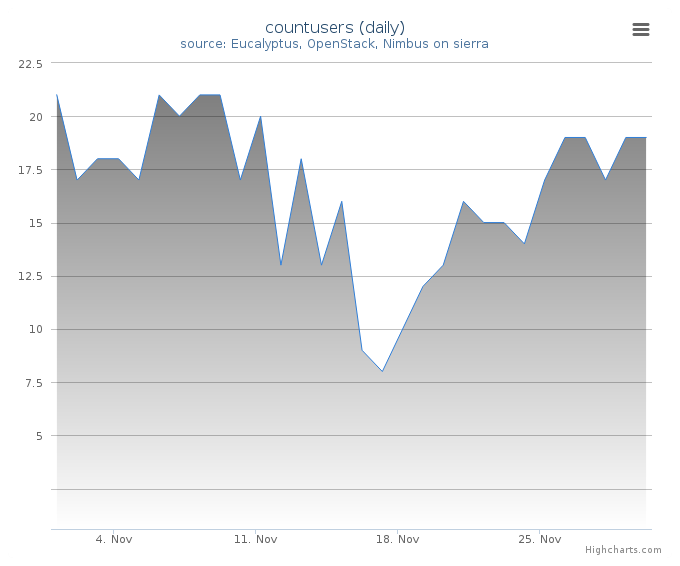
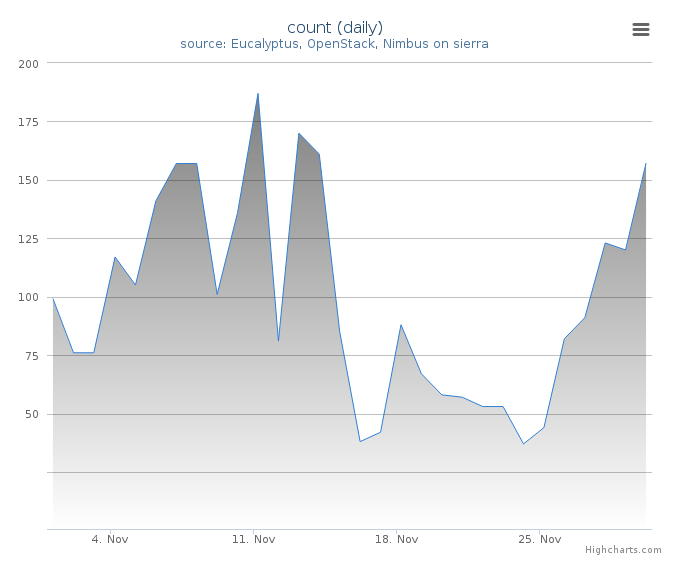
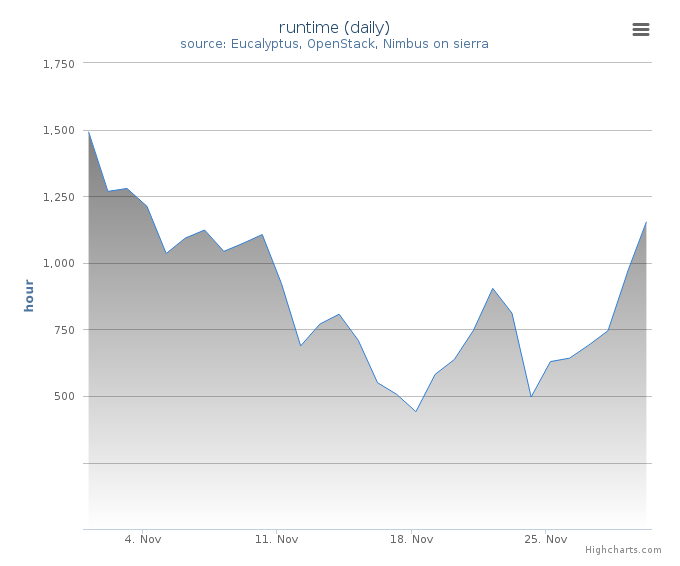
Period: November 01 – November 30, 2013
Cloud(IaaS): nimbus, openstack, eucalyptus
Hostname: sierra
| Project | Value |
|---|---|
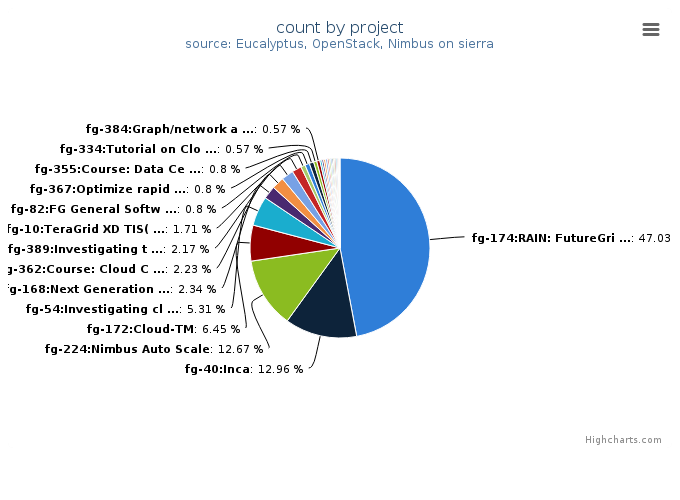
| fg-174:RAIN: FutureGrid Dynamic provisioning Framework | 824 |
| fg-40:Inca | 227 |
| fg-224:Nimbus Auto Scale | 222 |
| fg-172:Cloud-TM | 113 |
| fg-54:Investigating cloud computing as a solution for analyzing particle physics data | 93 |
| fg-168:Next Generation Sequencing in the Cloud | 41 |
| fg-362:Course: Cloud Computing and Storage (UF) | 39 |
| fg-389:Investigating the Apache Big Data Stack | 38 |
| fg-10:TeraGrid XD TIS(Technology Insertion Service) Technology Evaluation Laboratory | 30 |
| fg-82:FG General Software Development | 14 |
| fg-367:Optimize rapid deployment and updating of VM images at the remote compute cluster | 14 |
| fg-355:Course: Data Center Scale Computing Class | 14 |
| fg-334:Tutorial on Cloud Computing and Software-defined Networking | 10 |
| fg-384:Graph/network analysis Resource manager | 10 |
| fg-341:Course: Parallel Computing | 6 |
| fg-374:Course: Cloud and Distributed Computing | 6 |
| fg-97:FutureGrid and Grid‘5000 Collaboration | 6 |
| fg-363:Course: Applied Cyberinfrastructure concepts | 6 |
| fg-233:CINET - A Cyber-Infrastructure for Network Science | 5 |
| fg-364:Course: EEL6871 Autonomic Computing | 5 |
| fg-369:Testing of Network Facing Services for the Open Science Grid | 4 |
| fg-380:FutureGrid Support for BigData MOOC | 4 |
| fg-264:Course: 1st Workshop on bioKepler Tools and Its Applications | 4 |
| fg-382:Reliability Analysis using Hadoop and MapReduce | 4 |
| fg-215:FuturGrid Directory Entry | 4 |
| fg-371:Characterizing Infrastructure Cloud Performance for Scientific Computing | 3 |
| fg-243:Applied Cyberinfrastructure concepts | 3 |
| fg-1:Peer-to-peer overlay networks and applications in virtual networks and virtual clusters | 1 |
| fg-175:GridProphet, A workflow execution time prediction system for the Grid | 1 |
| fg-316:Course: Cloud Computing Class - third edition | 1 |
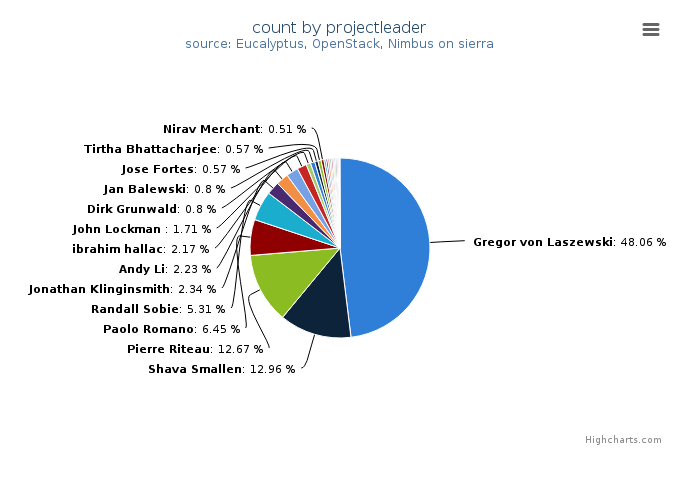
| Projectleader | Value |
|---|---|
| Gregor von Laszewski | 842 |
| Shava Smallen | 227 |
| Pierre Riteau | 222 |
| Paolo Romano | 113 |
| Randall Sobie | 93 |
| Jonathan Klinginsmith | 41 |
| Andy Li | 39 |
| ibrahim hallac | 38 |
| John Lockman | 30 |
| Dirk Grunwald | 14 |
| Jan Balewski | 14 |
| Jose Fortes | 10 |
| Tirtha Bhattacharjee | 10 |
| Nirav Merchant | 9 |
| Philip Rhodes | 6 |
| Mauricio Tsugawa | 6 |
| Wilson Rivera | 6 |
| Keith Bisset | 5 |
| Meng Han | 5 |
| Ilkay Altintas | 4 |
| Igor Sfiligoi | 4 |
| Carl Walasek | 4 |
| Abhilash Koppula | 4 |
| Theron Voran | 3 |
| Massimo Canonico | 1 |
| Thomas Fahringer | 1 |
| Renato Figueiredo | 1 |
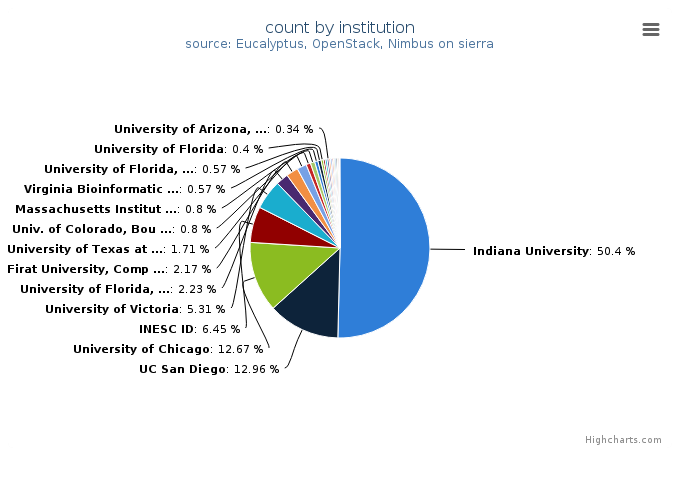
| Institution | Value |
|---|---|
| Indiana University | 883 |
| UC San Diego | 227 |
| University of Chicago | 222 |
| INESC ID | 113 |
| University of Victoria | 93 |
| University of Florida, Department of Electrical and Computer Eng | 39 |
| Firat University, Computer Science Department | 38 |
| University of Texas at Austin | 30 |
| Univ. of Colorado, Boulder, Computer Science | 14 |
| Massachusetts Institute of Technology, Laboratory for Nuclear Sc | 14 |
| Virginia Bioinformatics Institute, Virginia Polytechnic Institut | 10 |
| University of Florida, Advanced Computing and Information System | 10 |
| University of Florida | 7 |
| University of Mississippi, Department of Computer Science | 6 |
| University of Puerto Rico, Electrical and Computer Emgineering D | 6 |
| University of Arizona, Arizona Research Laboratories, School of | 6 |
| University of Florida, ACIS | 5 |
| Virginia Tech | 5 |
| University of the Sciences , Mathematics, Physics, and Statistic | 4 |
| University of California San Diego, Physics Department | 4 |
| Indiana University, Community Grids Lab | 4 |
| UCSD | 4 |
| University of Arizona | 3 |
| University of Colorado at Boulder, Computer Science Department | 3 |
| University of Innsbruck | 1 |
| University of Piemonte Orientale, Computer Science Department | 1 |
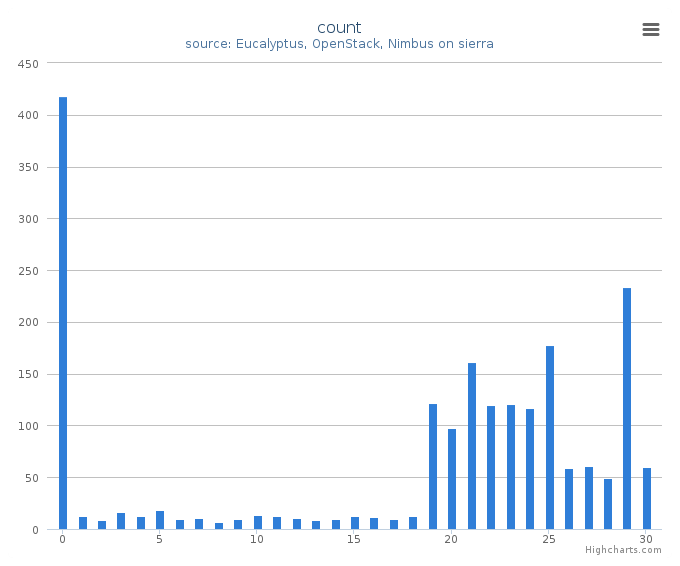
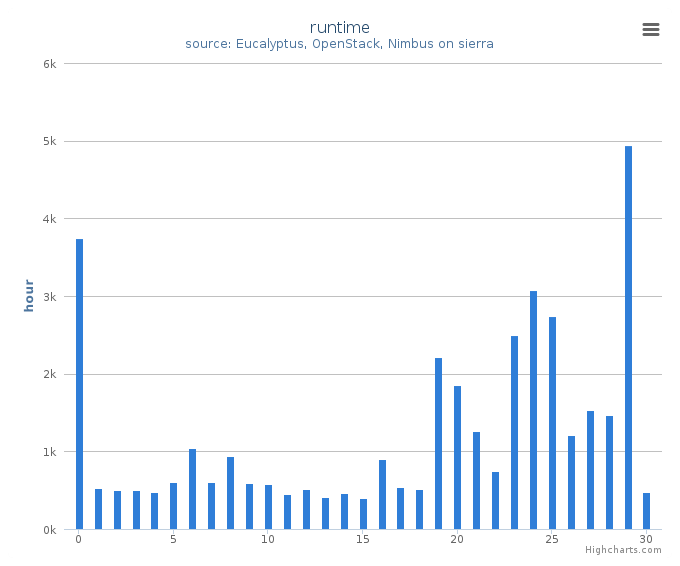
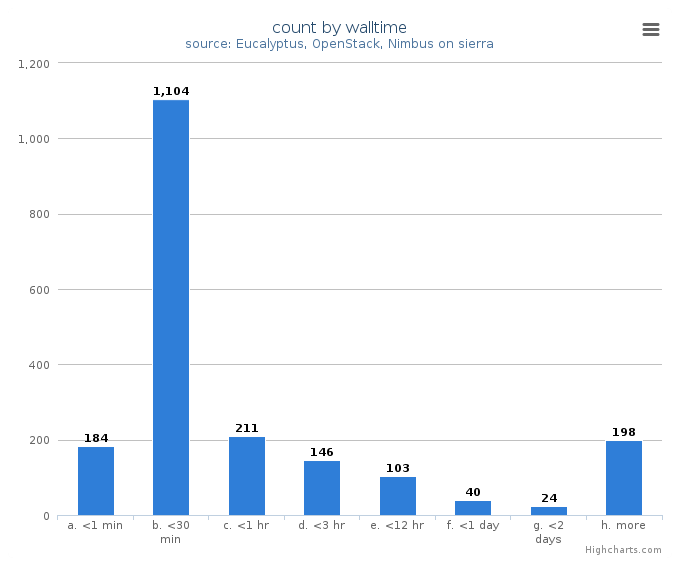
System information shows utilization distribution as to VMs count and wall time. Each cluster represents a compute node.