|
|
FutureGrid Cloud Metric |
|
|
FutureGrid Cloud Metric |
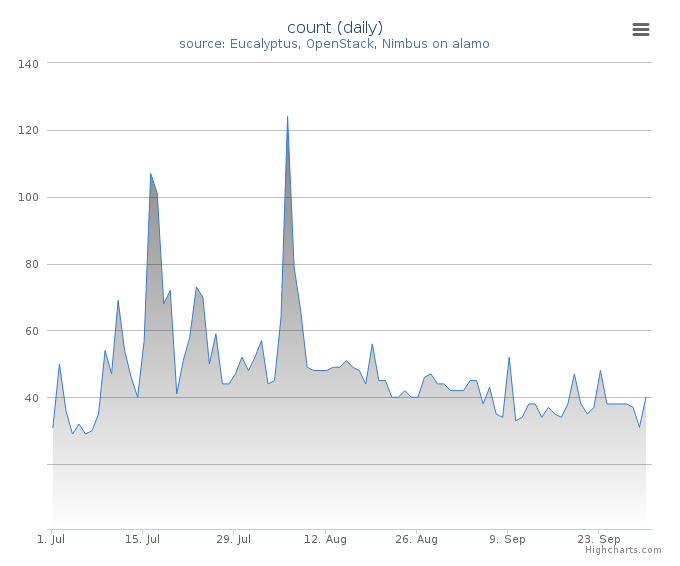
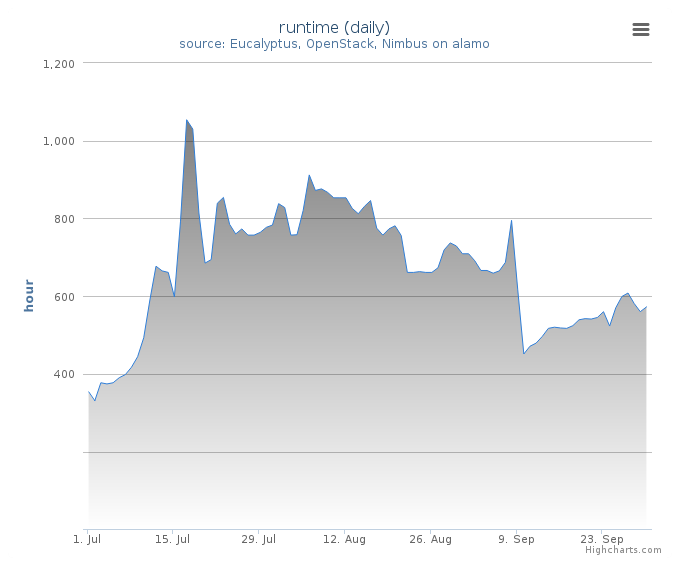
Period: July 01 – September 30, 2013
Cloud(IaaS): nimbus, openstack
Hostname: alamo
| Project | Value |
|---|---|
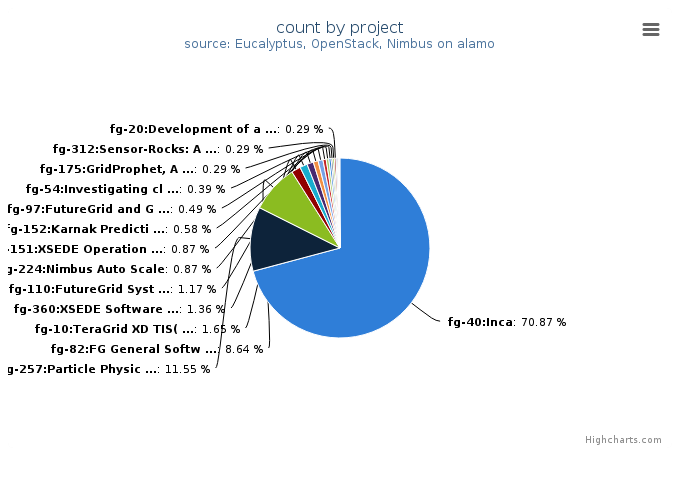
| fg-40:Inca | 730 |
| fg-257:Particle Physics Data analysis cluster for ATLAS LHC experiment | 119 |
| fg-82:FG General Software Development | 89 |
| fg-10:TeraGrid XD TIS(Technology Insertion Service) Technology Evaluation Laboratory | 17 |
| fg-360:XSEDE Software Development and Integration Testing | 14 |
| fg-110:FutureGrid Systems Development | 12 |
| fg-224:Nimbus Auto Scale | 9 |
| fg-151:XSEDE Operations Group | 9 |
| fg-152:Karnak Prediction Service | 6 |
| fg-97:FutureGrid and Grid‘5000 Collaboration | 5 |
| fg-54:Investigating cloud computing as a solution for analyzing particle physics data | 4 |
| fg-175:GridProphet, A workflow execution time prediction system for the Grid | 3 |
| fg-312:Sensor-Rocks: A novel integrated framework to improve software Operations and Management (O&M) and power management in environmental observing systems | 3 |
| fg-20:Development of an information service for FutureGrid | 3 |
| fg-367:Optimize rapid deployment and updating of VM images at the remote compute cluster | 2 |
| fg-1:Peer-to-peer overlay networks and applications in virtual networks and virtual clusters | 2 |
| fg-172:Cloud-TM | 1 |
| fg-90:Unicore and Genesis Experimentation | 1 |
| fg-136:JGC-DataCloud-2012 paper experiments | 1 |
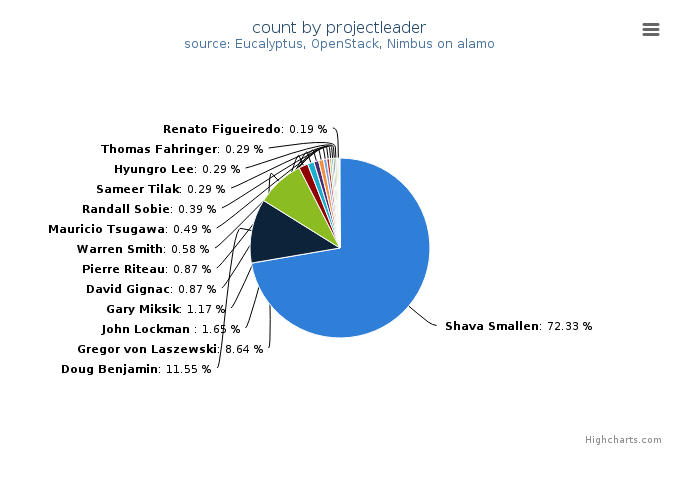
| Projectleader | Value |
|---|---|
| Shava Smallen | 745 |
| Doug Benjamin | 119 |
| Gregor von Laszewski | 89 |
| John Lockman | 17 |
| Gary Miksik | 12 |
| David Gignac | 9 |
| Pierre Riteau | 9 |
| Warren Smith | 6 |
| Mauricio Tsugawa | 5 |
| Randall Sobie | 4 |
| Sameer Tilak | 3 |
| Hyungro Lee | 3 |
| Thomas Fahringer | 3 |
| Jan Balewski | 2 |
| Renato Figueiredo | 2 |
| Mats Rynge | 1 |
| Paolo Romano | 1 |
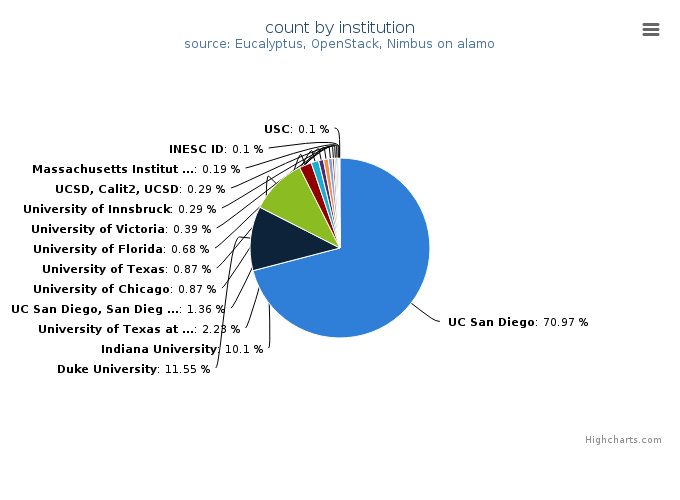
| Institution | Value |
|---|---|
| UC San Diego | 731 |
| Duke University | 119 |
| Indiana University | 104 |
| University of Texas at Austin | 23 |
| UC San Diego, San Diego Supercomputer Center | 14 |
| University of Chicago | 9 |
| University of Texas | 9 |
| University of Florida | 7 |
| University of Victoria | 4 |
| University of Innsbruck | 3 |
| UCSD, Calit2, UCSD | 3 |
| Massachusetts Institute of Technology, Laboratory for Nuclear Sc | 2 |
| INESC ID | 1 |
| USC | 1 |
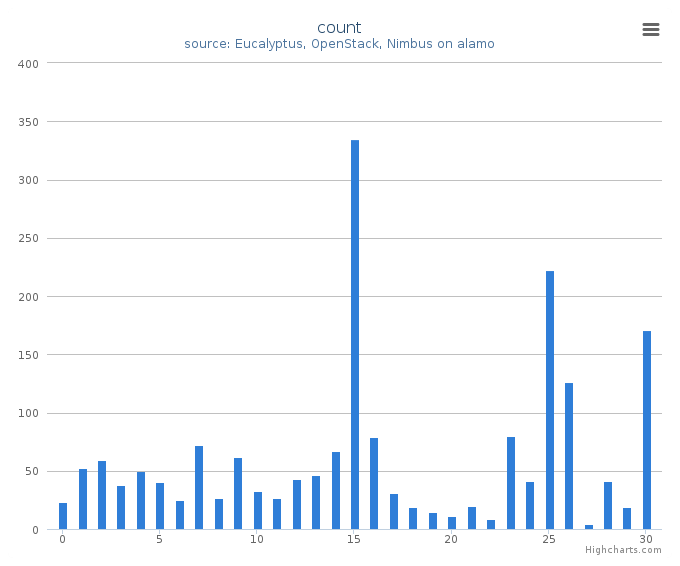
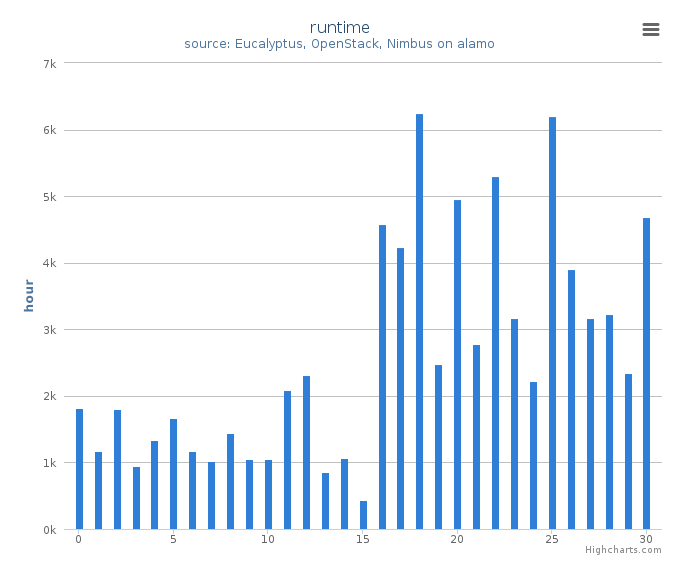
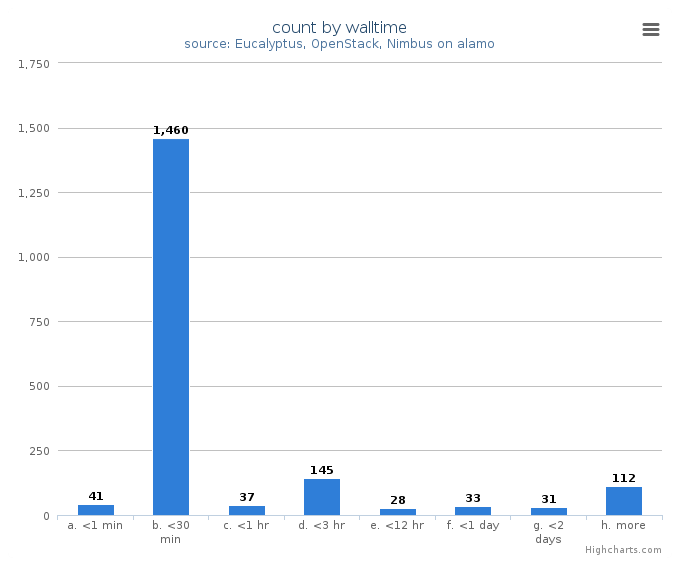
System information shows utilization distribution as to VMs count and wall time. Each cluster represents a compute node.