|
|
FutureGrid Cloud Metric |
|
|
FutureGrid Cloud Metric |
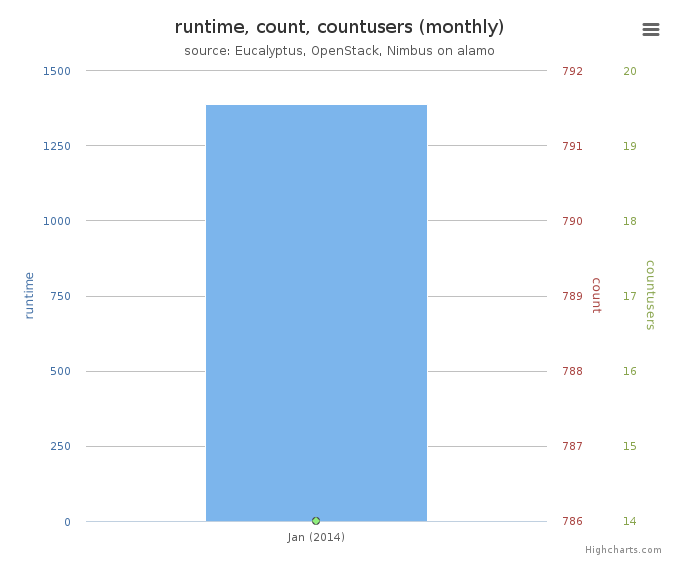
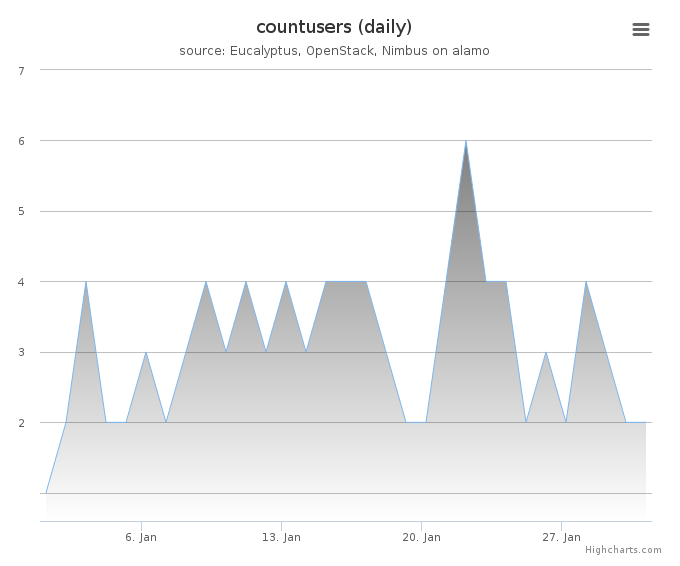
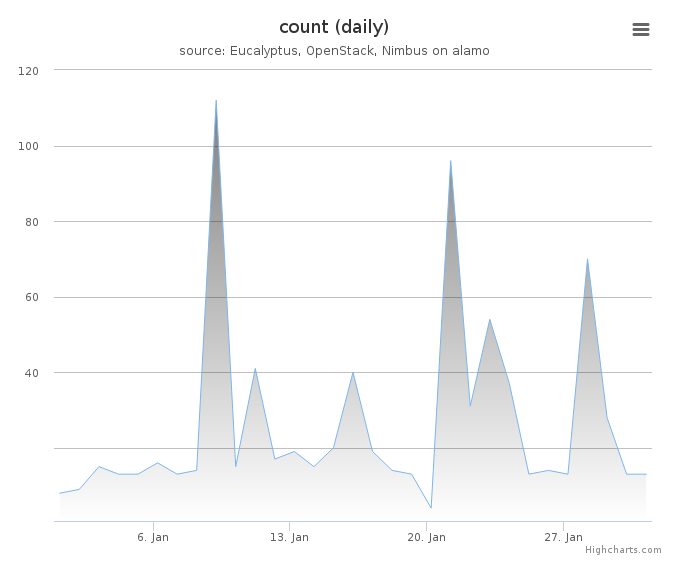
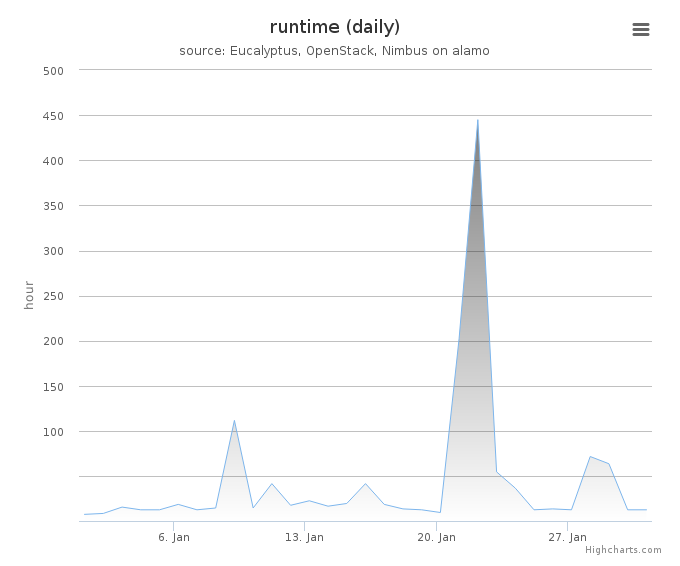
Period: January 01 – January 31, 2014
Cloud(IaaS): nimbus, openstack
Hostname: alamo
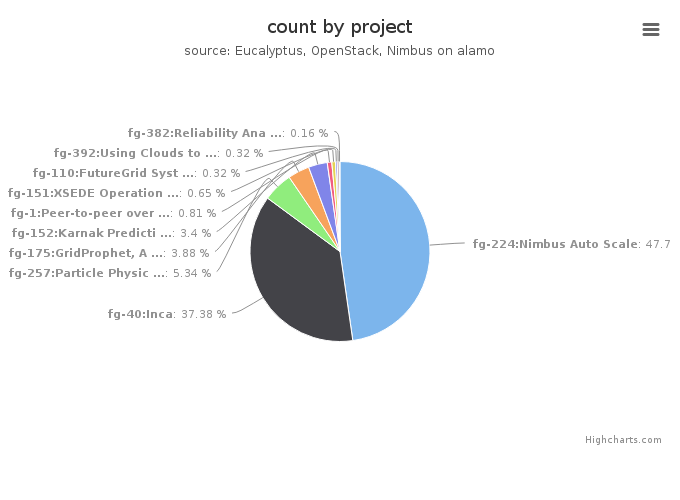
| Project | Value |
|---|---|
| fg-224:Nimbus Auto Scale | 295 |
| fg-40:Inca | 231 |
| fg-257:Particle Physics Data analysis cluster for ATLAS LHC experiment | 33 |
| fg-175:GridProphet, A workflow execution time prediction system for the Grid | 24 |
| fg-152:Karnak Prediction Service | 21 |
| fg-1:Peer-to-peer overlay networks and applications in virtual networks and virtual clusters | 5 |
| fg-151:XSEDE Operations Group | 4 |
| fg-110:FutureGrid Systems Development | 2 |
| fg-392:Using Clouds to Scale GIS Applications | 2 |
| fg-382:Reliability Analysis using Hadoop and MapReduce | 1 |
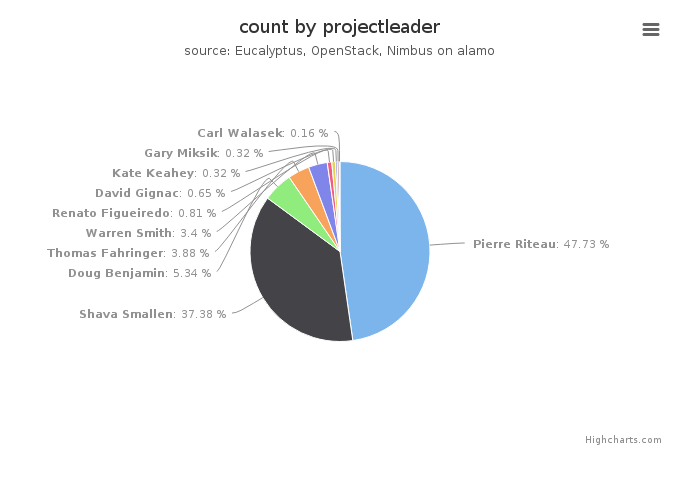
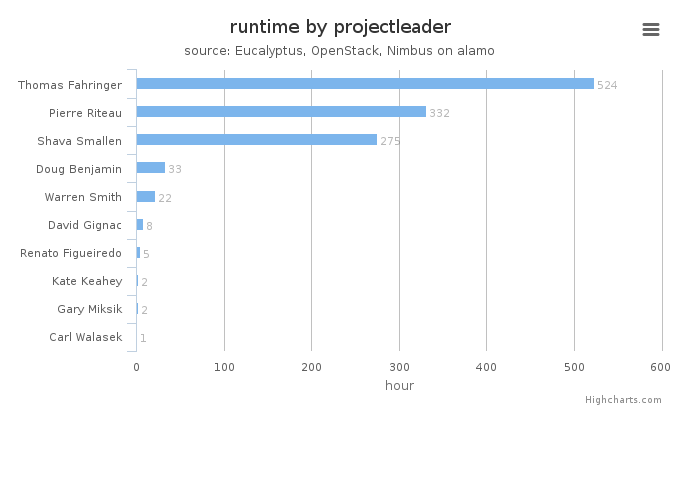
| Projectleader | Value |
|---|---|
| Pierre Riteau | 295 |
| Shava Smallen | 231 |
| Doug Benjamin | 33 |
| Thomas Fahringer | 24 |
| Warren Smith | 21 |
| Renato Figueiredo | 5 |
| David Gignac | 4 |
| Kate Keahey | 2 |
| Gary Miksik | 2 |
| Carl Walasek | 1 |
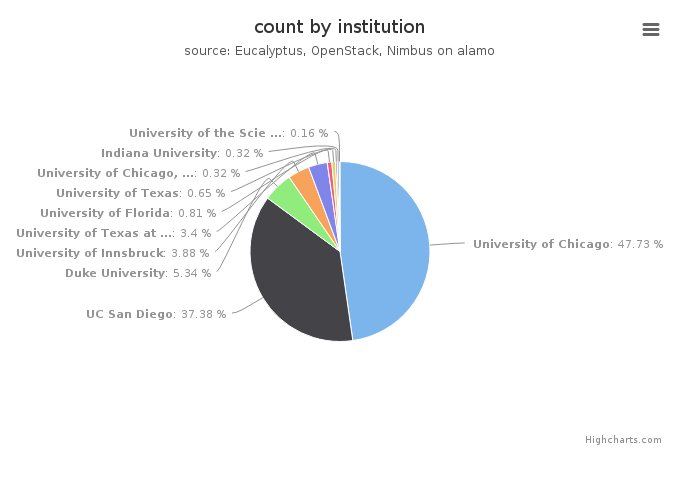
| Institution | Value |
|---|---|
| University of Chicago | 295 |
| UC San Diego | 231 |
| Duke University | 33 |
| University of Innsbruck | 24 |
| University of Texas at Austin | 21 |
| University of Florida | 5 |
| University of Texas | 4 |
| University of Chicago, Computation Institute | 2 |
| Indiana University | 2 |
| University of the Sciences , Mathematics, Physics, and Statistic | 1 |
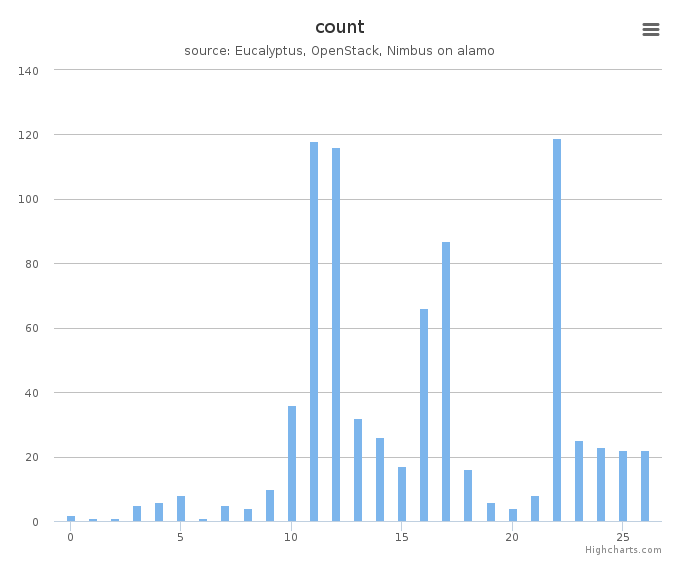
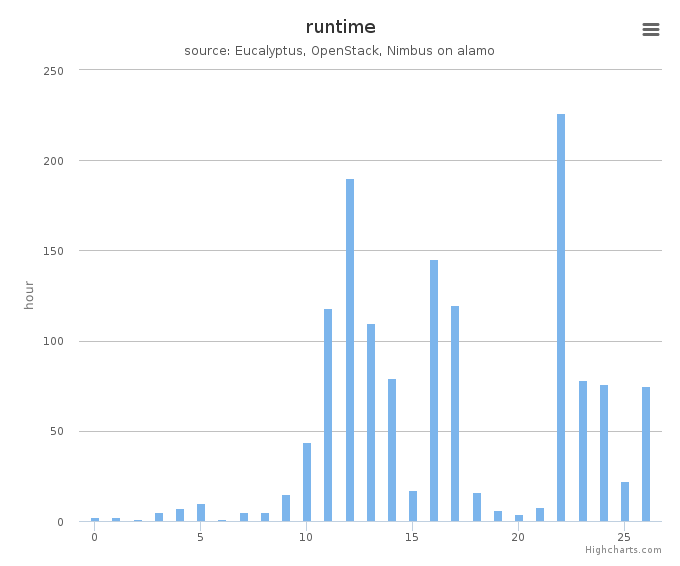
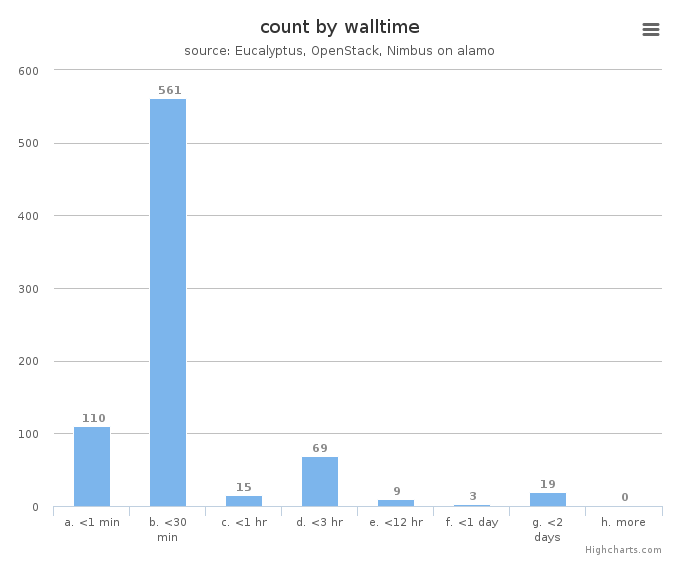
System information shows utilization distribution as to VMs count and wall time. Each cluster represents a compute node.