|
|
FutureGrid Cloud Metric |
|
|
FutureGrid Cloud Metric |
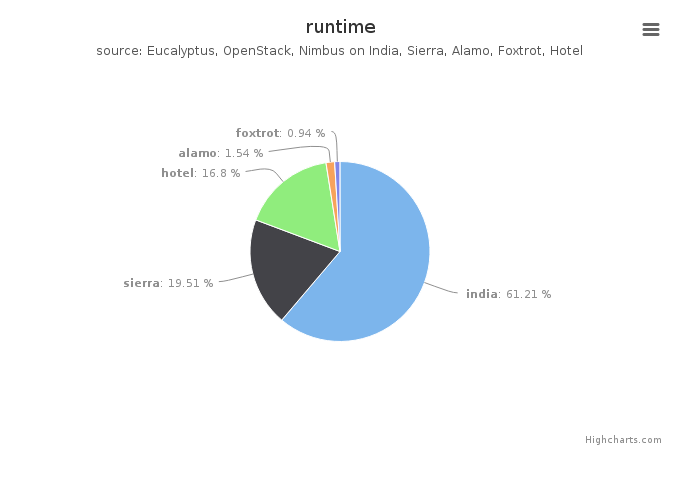
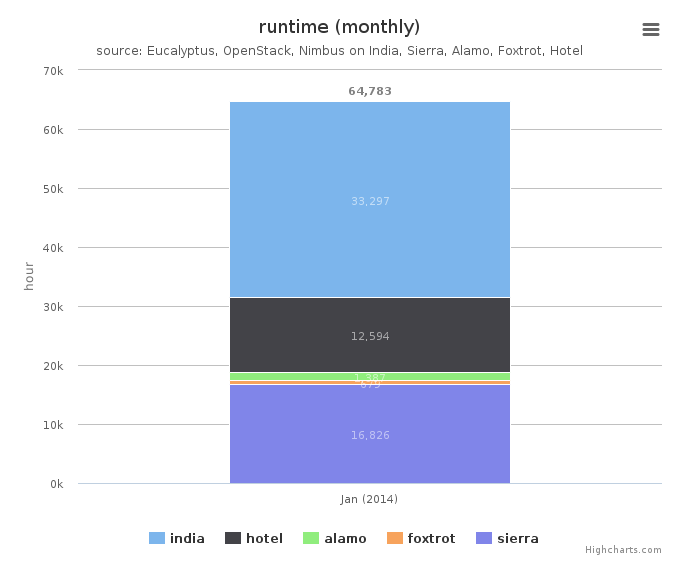
Period: January 01 – January 31, 2014
| Total | Value |
|---|---|
| india | 55176.0 |
| sierra | 17589.0 |
| hotel | 15146.0 |
| alamo | 1387.0 |
| foxtrot | 851.0 |
Period: January 01 – January 31, 2014
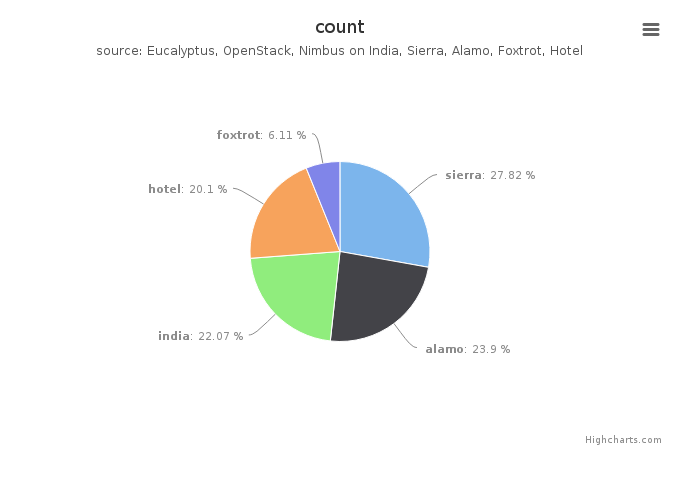
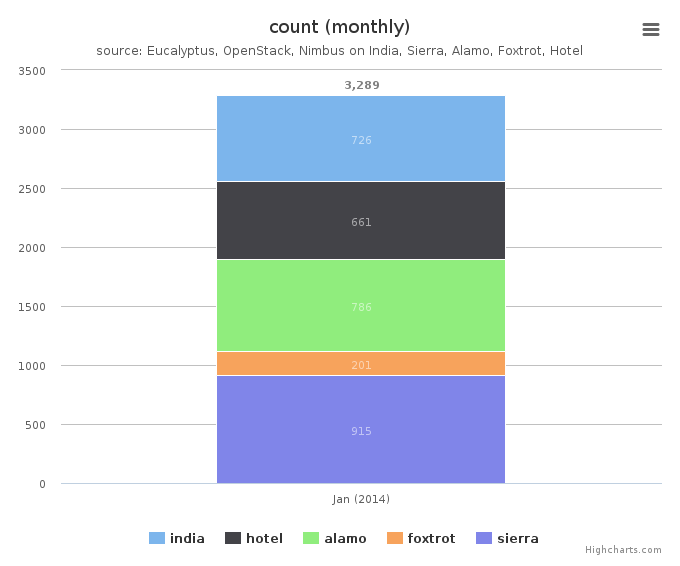
Period: January 01 – January 31, 2014
| Total | Value |
|---|---|
| sierra | 915 |
| alamo | 786 |
| india | 726 |
| hotel | 661 |
| foxtrot | 201 |
Period: January 01 – January 31, 2014
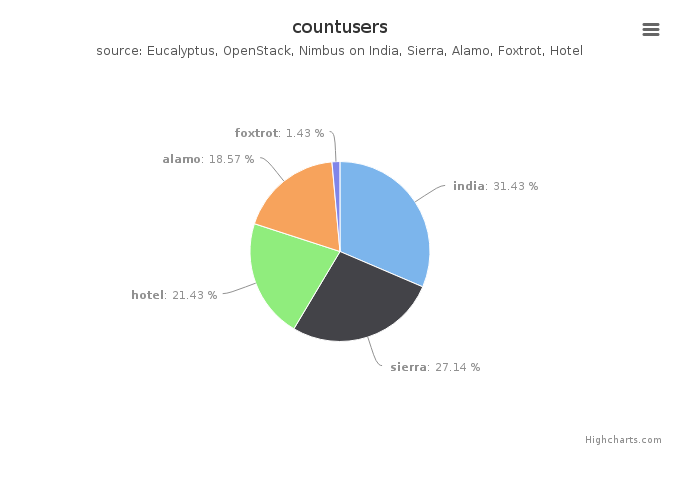
Period: January 01 – January 31, 2014
| Total | Value |
|---|---|
| india | 22 |
| sierra | 19 |
| hotel | 15 |
| alamo | 13 |
| foxtrot | 1 |
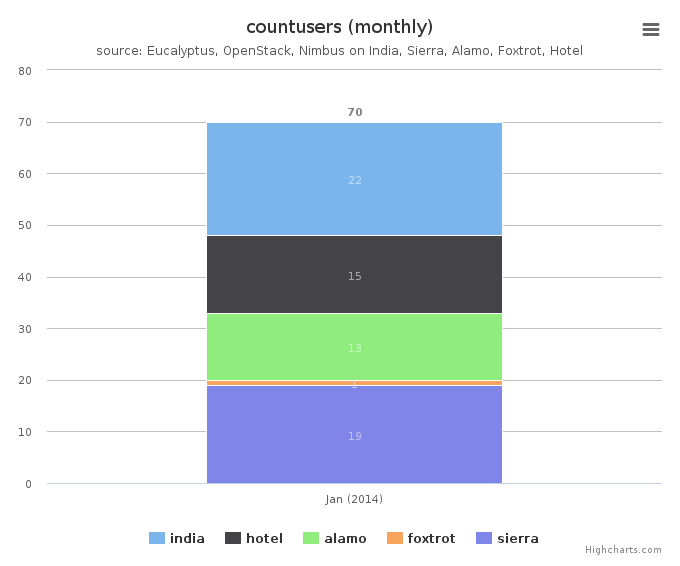
Period: January 01 – January 31, 2014