|
|
FutureGrid Cloud Metric |
|
|
FutureGrid Cloud Metric |
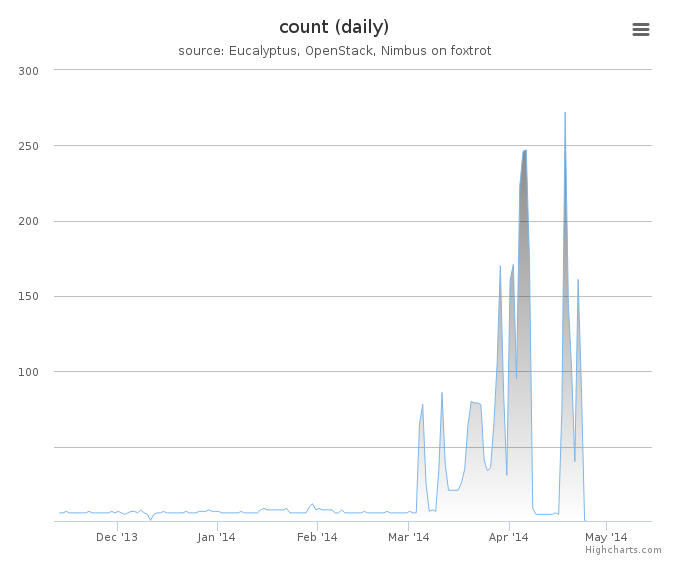
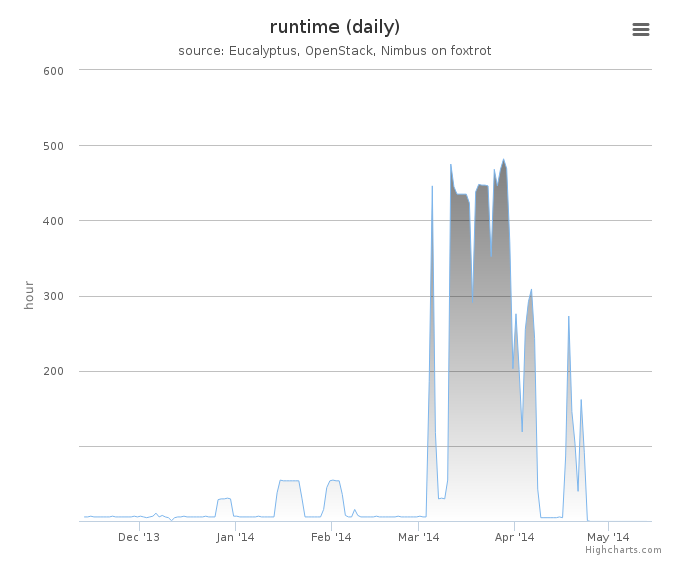
Period: November 13 – May 13, 2014
Cloud(IaaS): nimbus
Hostname: foxtrot
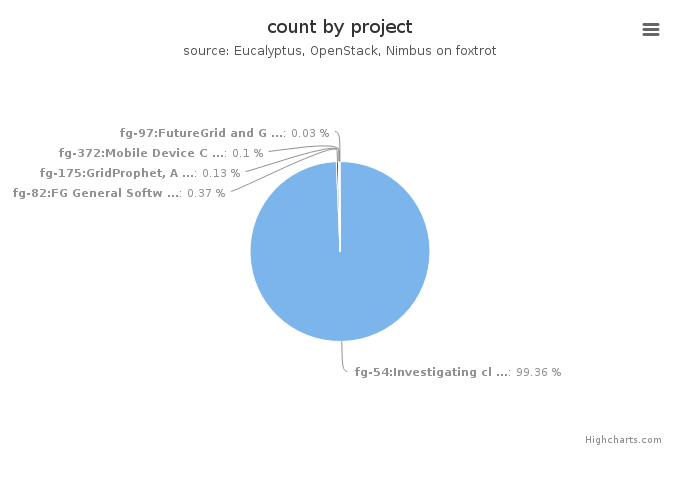
| Project | Value |
|---|---|
| fg-54:Investigating cloud computing as a solution for analyzing particle physics data | 2948 |
| fg-82:FG General Software Development | 11 |
| fg-175:GridProphet, A workflow execution time prediction system for the Grid | 4 |
| fg-372:Mobile Device Computation Offloading over SocialVPNs | 3 |
| fg-97:FutureGrid and Grid‘5000 Collaboration | 1 |
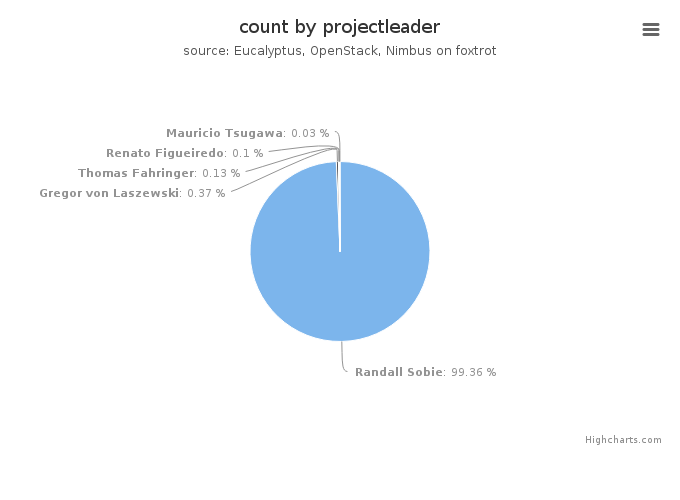
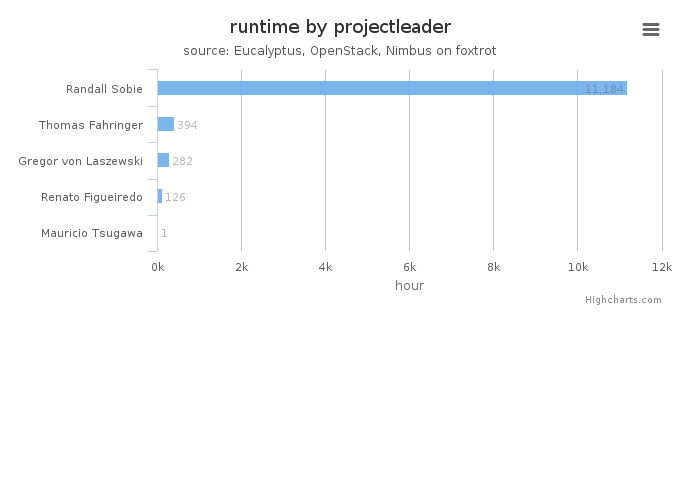
| Projectleader | Value |
|---|---|
| Randall Sobie | 2948 |
| Gregor von Laszewski | 11 |
| Thomas Fahringer | 4 |
| Renato Figueiredo | 3 |
| Mauricio Tsugawa | 1 |
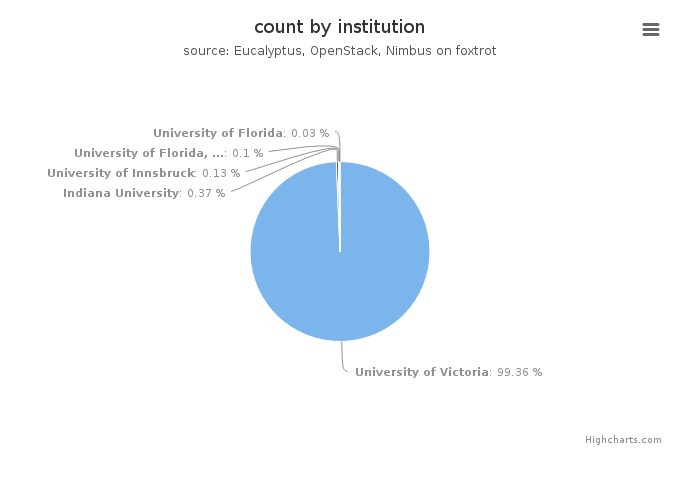
| Institution | Value |
|---|---|
| University of Victoria | 2948 |
| Indiana University | 11 |
| University of Innsbruck | 4 |
| University of Florida, Electrical and Computer Engineering | 3 |
| University of Florida | 1 |
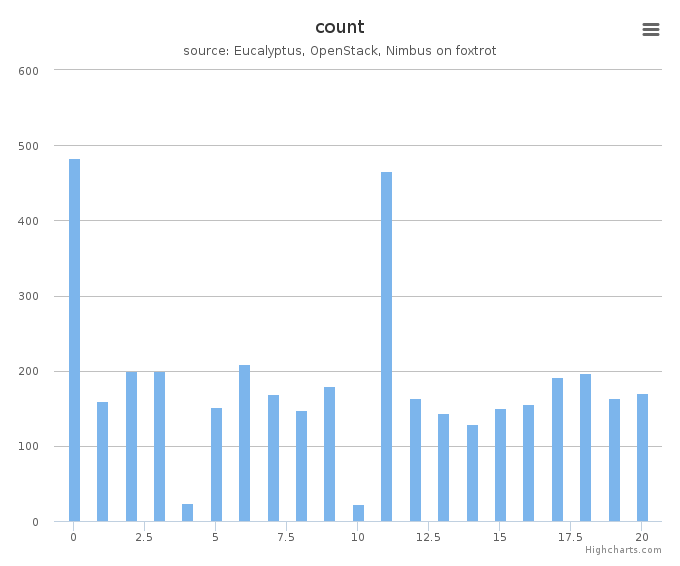
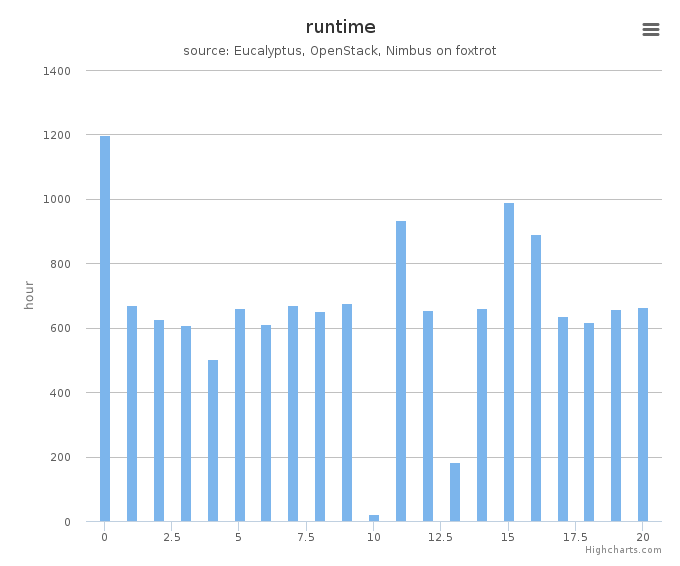
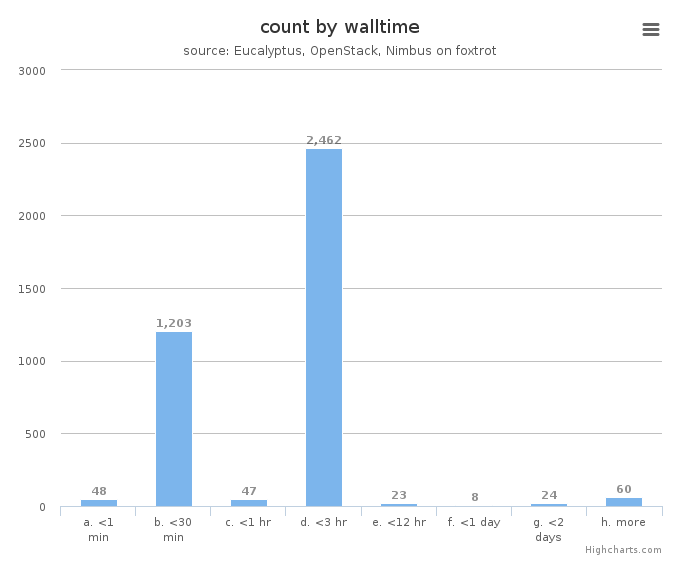
System information shows utilization distribution as to VMs count and wall time. Each cluster represents a compute node.