|
|
FutureGrid Cloud Metric |
|
|
FutureGrid Cloud Metric |
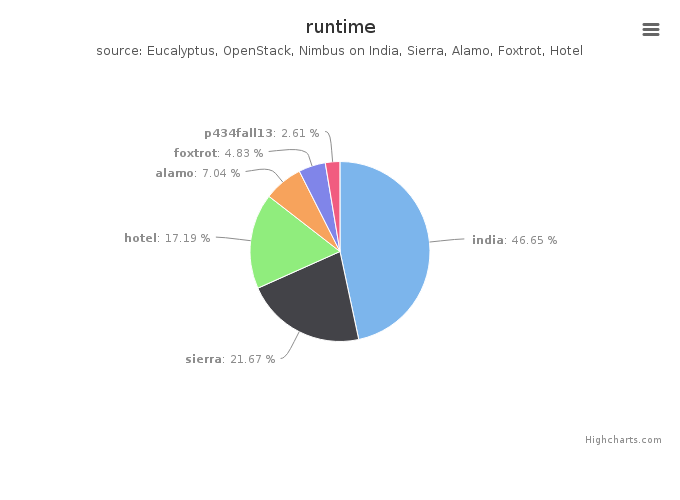
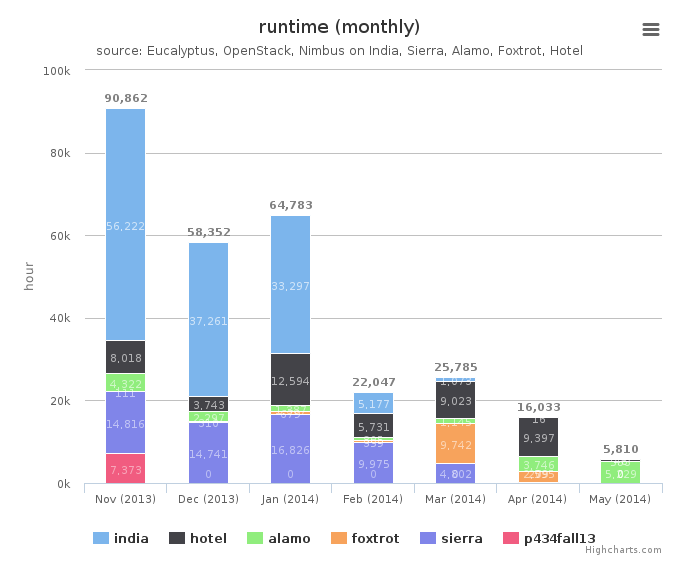
Period: November 13 – May 13, 2014
| Total | Value |
|---|---|
| india | 133134.0 |
| sierra | 61833.0 |
| hotel | 49041.0 |
| alamo | 20103.0 |
| foxtrot | 13790.0 |
| p434fall13 | 7462.0 |
Period: November 13 – May 13, 2014
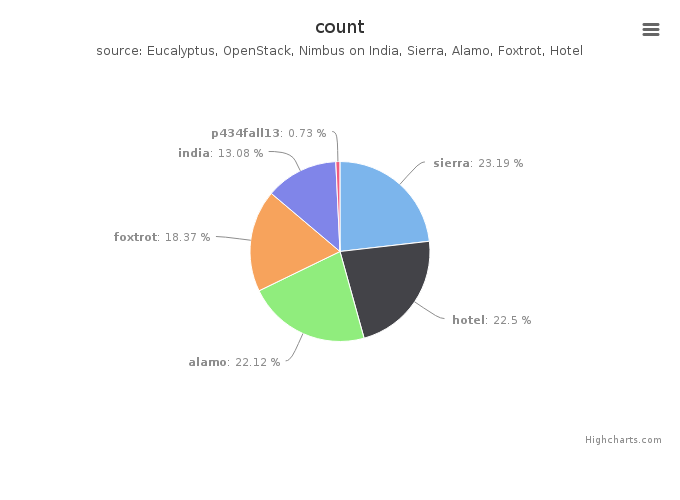
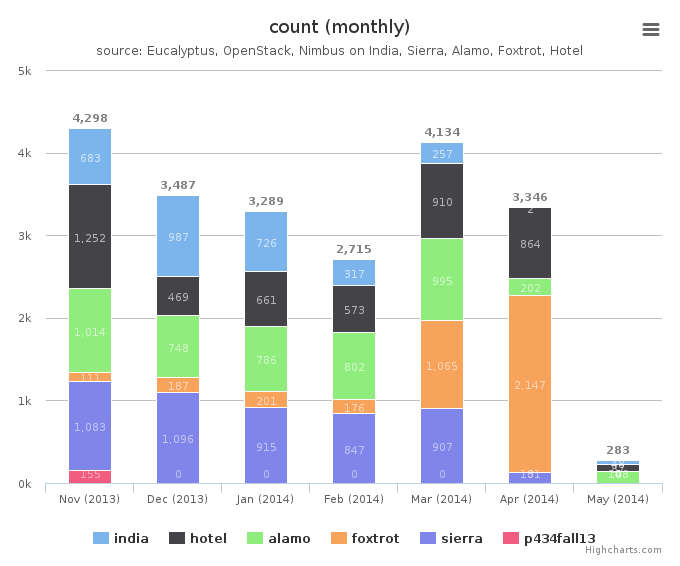
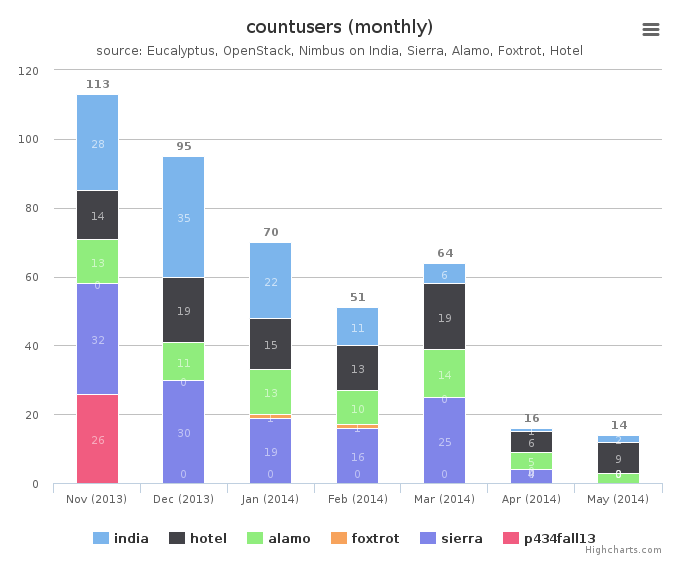
Period: November 13 – May 13, 2014
| Total | Value |
|---|---|
| sierra | 4892 |
| hotel | 4746 |
| alamo | 4665 |
| foxtrot | 3875 |
| india | 2760 |
| p434fall13 | 155 |
Period: November 13 – May 13, 2014
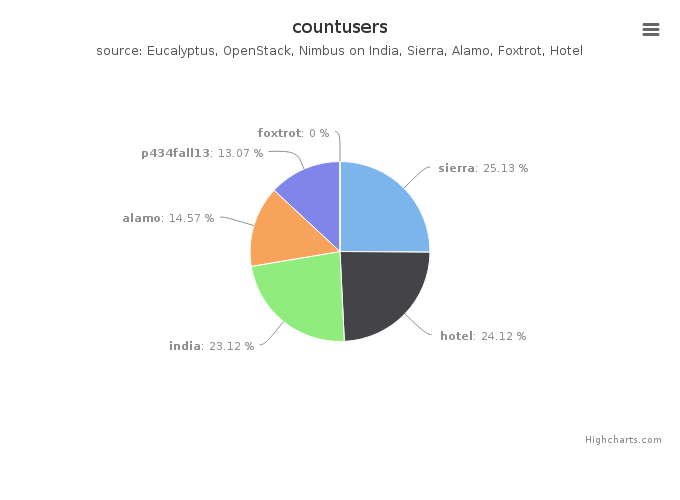
Period: November 13 – May 13, 2014
| Total | Value |
|---|---|
| sierra | 50 |
| hotel | 48 |
| india | 46 |
| alamo | 29 |
| p434fall13 | 26 |
| foxtrot | 0 |
Period: November 13 – May 13, 2014