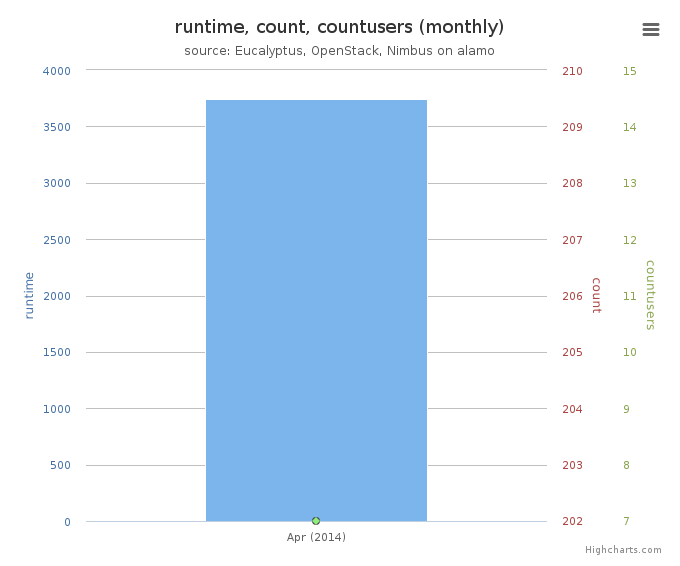
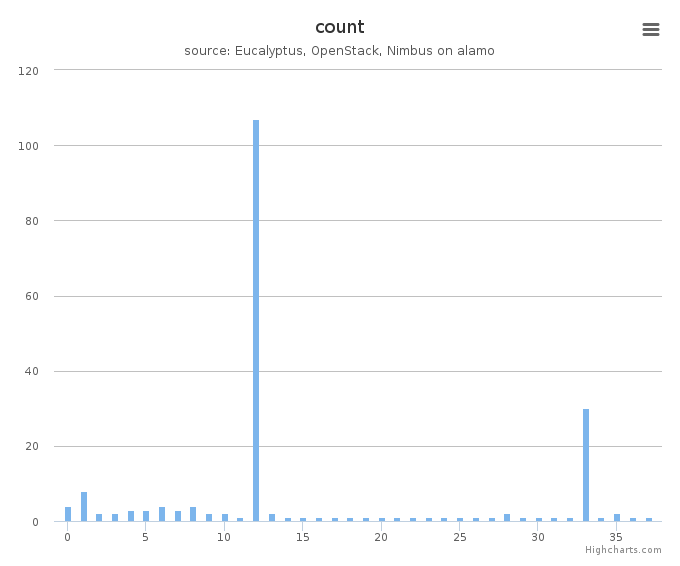
Distribution
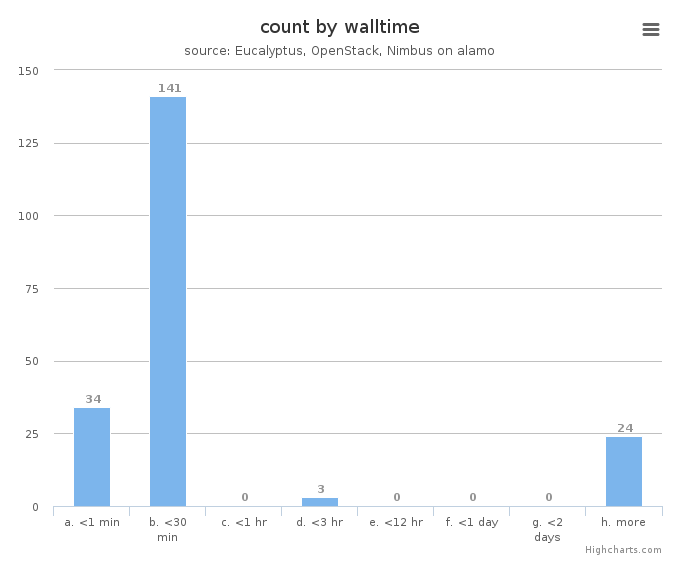
Figure 5: VM count by wall time
This chart illustrates usage patterns of VM instances in terms of running wall time.
- Period: April 01 – April 30, 2014
- Cloud(IaaS): nimbus, openstack
- Hostname: alamo

Figure 6: VMs count by project
This chart illustrates the proportion of launched VM instances by project groups. The same data in tabular form follows.
- Period: April 01 – April 30, 2014
- Cloud(IaaS): nimbus, openstack
- Hostname: alamo
VMs count by project
| Project |
Value |
|---|
| fg-40:Inca |
56 |
| fg-367:Optimize rapid deployment and updating of VM images at the remote compute cluster |
55 |
| fg-97:FutureGrid and Grid‘5000 Collaboration |
7 |
| fg-110:FutureGrid Systems Development |
4 |
| fg-151:XSEDE Operations Group |
1 |
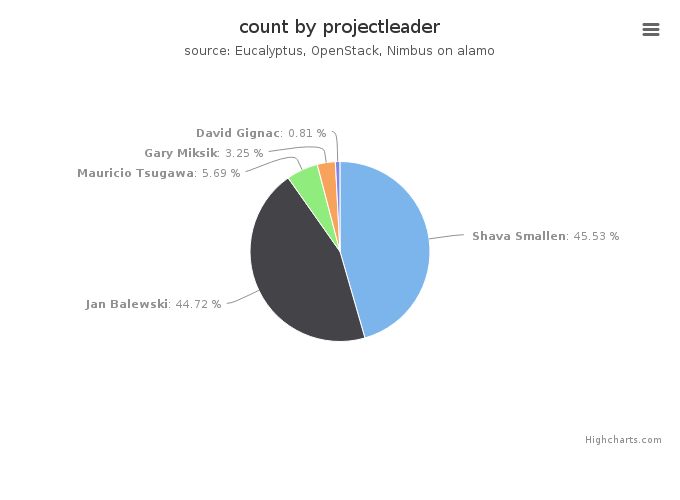
Figure 7: VMs count by project leader
This chart also illustrates the proportion of launched VM instances by project Leader. The same data in tabular form follows.
- Period: April 01 – April 30, 2014
- Cloud(IaaS): nimbus, openstack
- Hostname: alamo
VMs count by project leader
| Projectleader |
Value |
|---|
| Shava Smallen |
56 |
| Jan Balewski |
55 |
| Mauricio Tsugawa |
7 |
| Gary Miksik |
4 |
| David Gignac |
1 |

Figure 8: VMs count by institution
This chart illustrates the proportion of launched VM instances by Institution. The same data in tabular form follows.
- Period: April 01 – April 30, 2014
- Cloud(IaaS): nimbus, openstack
- Hostname: alamo
VMs count by institution
| Institution |
Value |
|---|
| UC San Diego |
56 |
| Massachusetts Institute of Technology, Laboratory for Nuclear Sc |
55 |
| University of Florida |
7 |
| Indiana University |
4 |
| University of Texas |
1 |
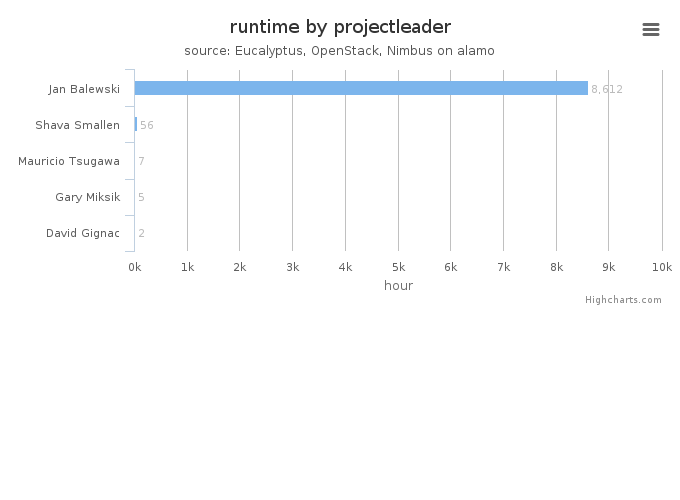
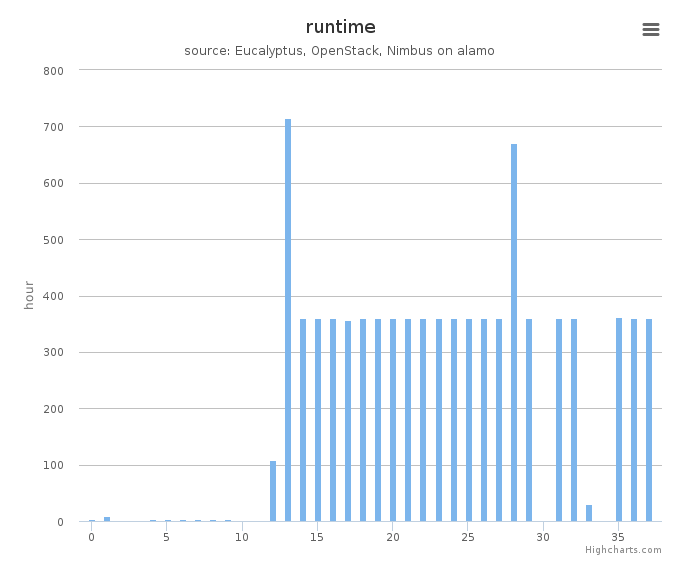
Figure 9: Wall time (hours) by project leader
This chart illustrates proportionate total run times by project leader.
- Period: April 01 – April 30, 2014
- Cloud(IaaS): nimbus, openstack
- Hostname: alamo