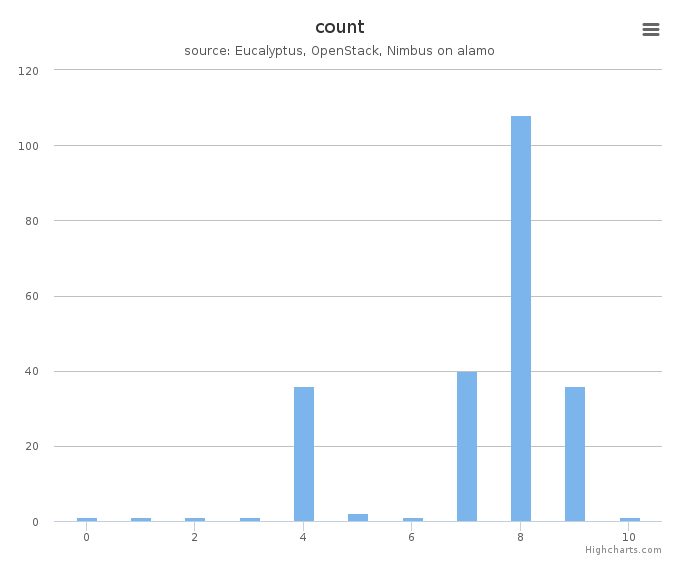
Distribution
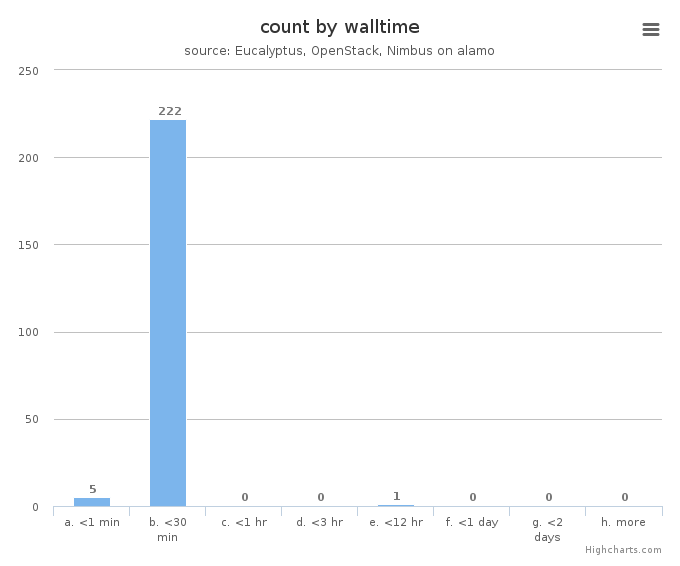
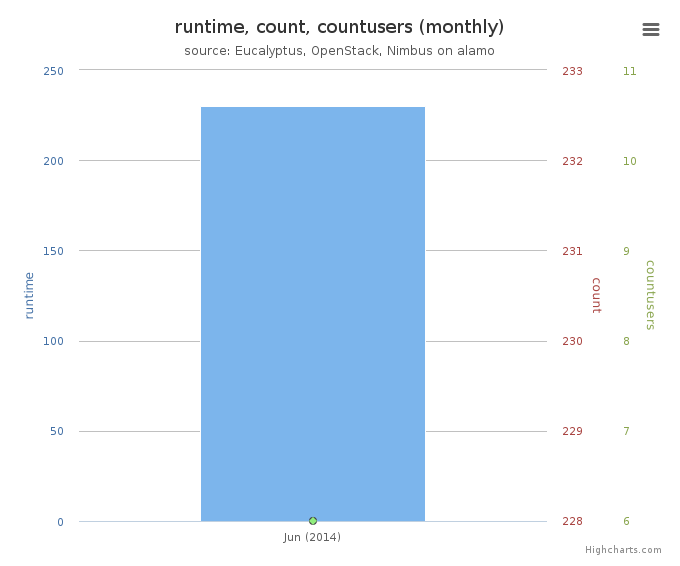
Figure 5: VM count by wall time
This chart illustrates usage patterns of VM instances in terms of running wall time.
- Period: June 01 – June 30, 2014
- Cloud(IaaS): nimbus, openstack
- Hostname: alamo
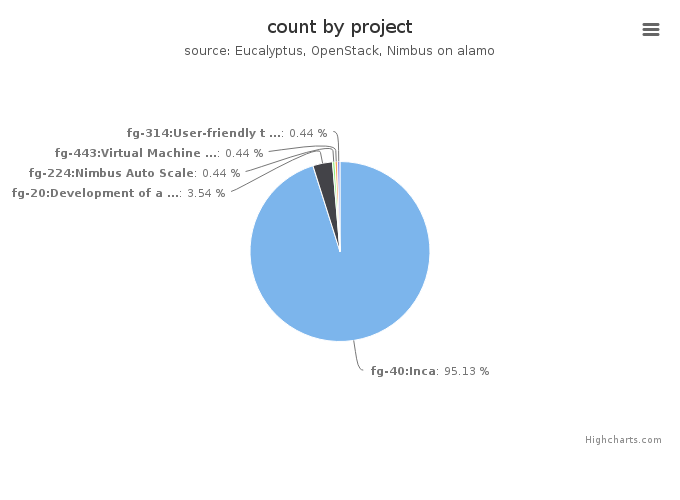
Figure 6: VMs count by project
This chart illustrates the proportion of launched VM instances by project groups. The same data in tabular form follows.
- Period: June 01 – June 30, 2014
- Cloud(IaaS): nimbus, openstack
- Hostname: alamo
VMs count by project
| Project |
Value |
|---|
| fg-40:Inca |
215 |
| fg-20:Development of an information service for FutureGrid |
8 |
| fg-224:Nimbus Auto Scale |
1 |
| fg-443:Virtual Machine Live Migration for Disaster Recovery in WANs |
1 |
| fg-314:User-friendly tools to play with cloud platforms |
1 |
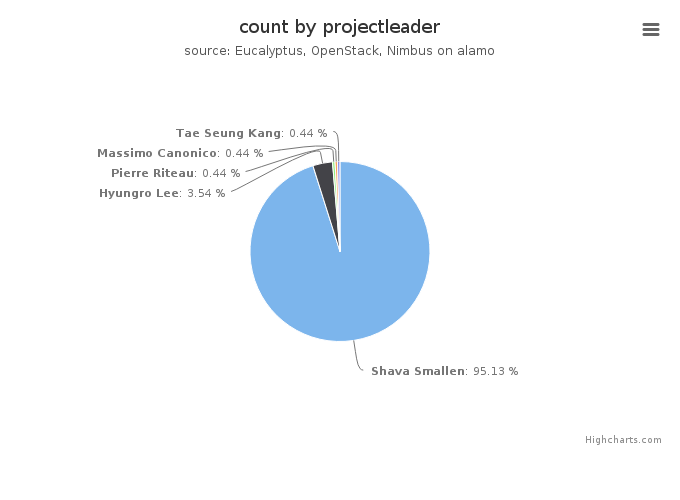
Figure 7: VMs count by project leader
This chart also illustrates the proportion of launched VM instances by project Leader. The same data in tabular form follows.
- Period: June 01 – June 30, 2014
- Cloud(IaaS): nimbus, openstack
- Hostname: alamo
VMs count by project leader
| Projectleader |
Value |
|---|
| Shava Smallen |
215 |
| Hyungro Lee |
8 |
| Pierre Riteau |
1 |
| Massimo Canonico |
1 |
| Tae Seung Kang |
1 |
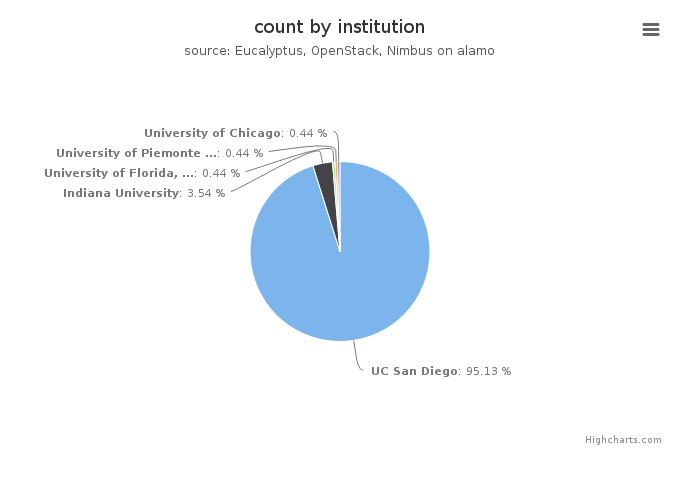
Figure 8: VMs count by institution
This chart illustrates the proportion of launched VM instances by Institution. The same data in tabular form follows.
- Period: June 01 – June 30, 2014
- Cloud(IaaS): nimbus, openstack
- Hostname: alamo
VMs count by institution
| Institution |
Value |
|---|
| UC San Diego |
215 |
| Indiana University |
8 |
| University of Florida, Advanced Computing and Information System |
1 |
| University of Piemonte Orientale, Computer Science Department |
1 |
| University of Chicago |
1 |
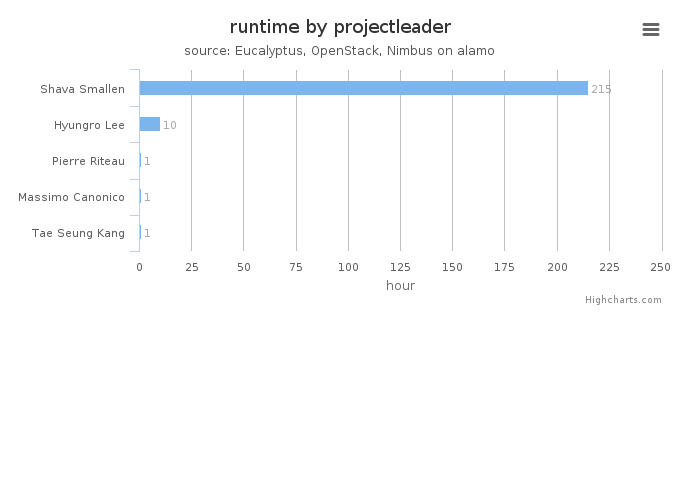
Figure 9: Wall time (hours) by project leader
This chart illustrates proportionate total run times by project leader.
- Period: June 01 – June 30, 2014
- Cloud(IaaS): nimbus, openstack
- Hostname: alamo