|
|
FutureGrid Cloud Metric |
|
|
FutureGrid Cloud Metric |
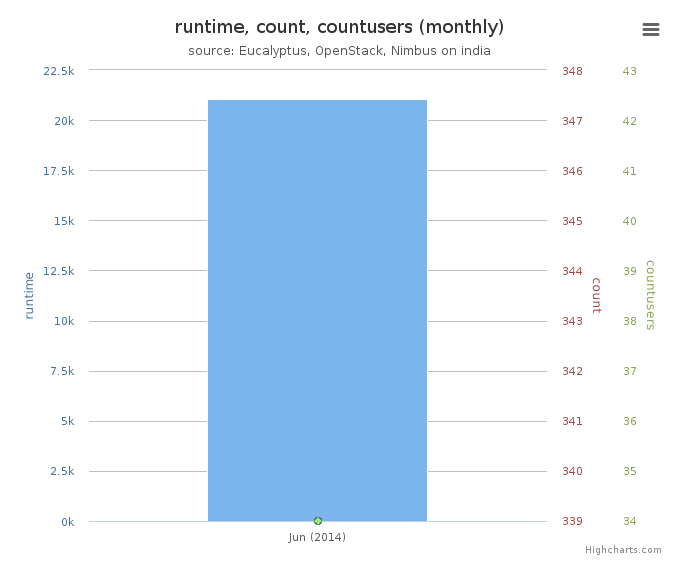
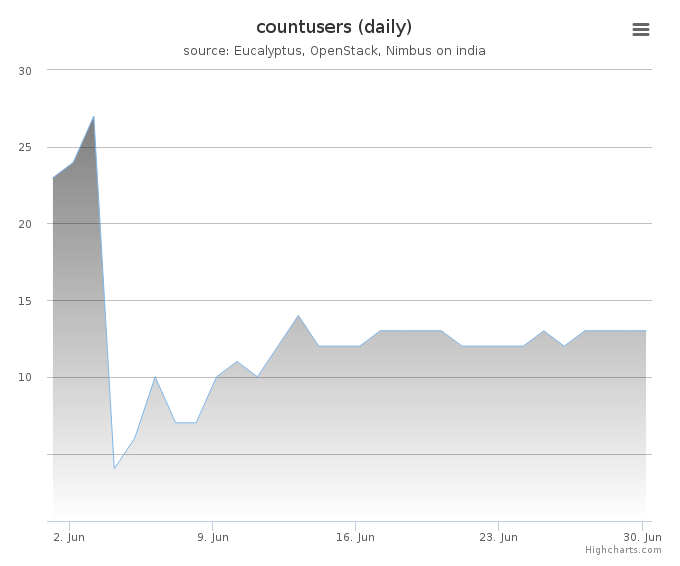
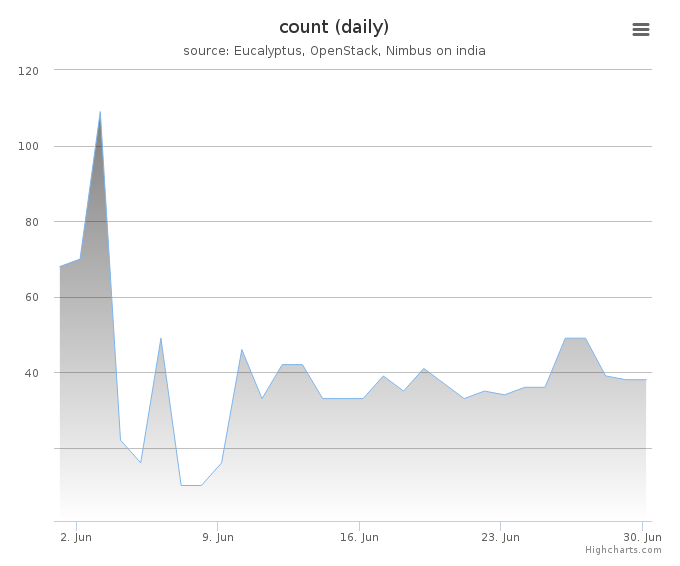
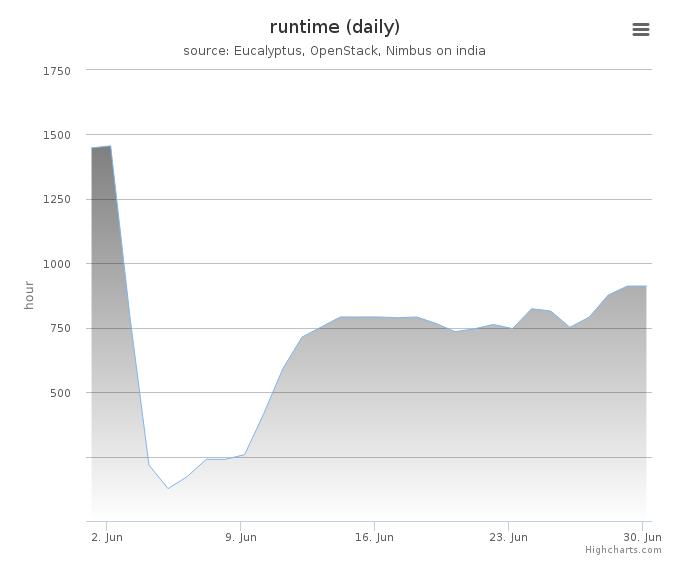
Period: June 01 – June 30, 2014
Cloud(IaaS): openstack, eucalyptus
Hostname: india
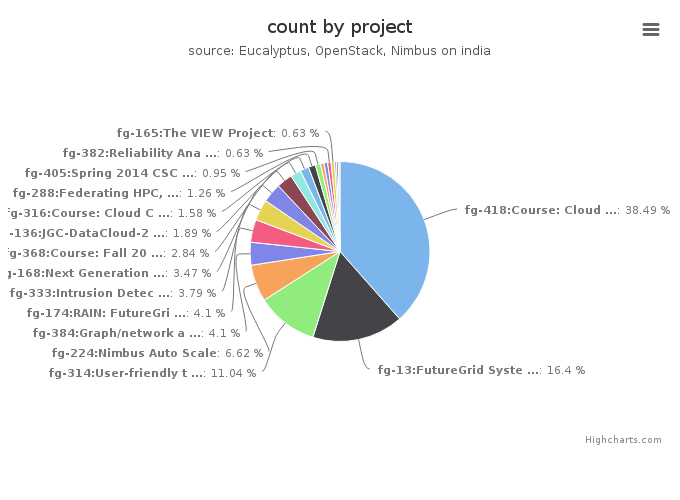
| Project | Value |
|---|---|
| fg-418:Course: Cloud Computing Class - fourth edition | 122 |
| fg-13:FutureGrid Systems Development and Prototyping | 52 |
| fg-314:User-friendly tools to play with cloud platforms | 35 |
| fg-224:Nimbus Auto Scale | 21 |
| fg-384:Graph/network analysis Resource manager | 13 |
| fg-174:RAIN: FutureGrid Dynamic provisioning Framework | 13 |
| fg-333:Intrusion Detection and Prevention for Infrastructure as a Service Cloud Computing System | 12 |
| fg-168:Next Generation Sequencing in the Cloud | 11 |
| fg-368:Course: Fall 2013 P434 Distributed Systems Undergraduate Course | 9 |
| fg-136:JGC-DataCloud-2012 paper experiments | 6 |
| fg-316:Course: Cloud Computing Class - third edition | 5 |
| fg-288:Federating HPC, Cyberinfrastructure and Clouds using CometCloud | 4 |
| fg-405:Spring 2014 CSCI-B649 Cloud Computing MOOC for residential and online students | 3 |
| fg-175:GridProphet, A workflow execution time prediction system for the Grid | 2 |
| fg-432:2014 Topics in Parallel Computation | 2 |
| fg-382:Reliability Analysis using Hadoop and MapReduce | 2 |
| fg-165:The VIEW Project | 2 |
| fg-214:Mining Interactions between Network Community Structure and Information Diffusion | 1 |
| fg-362:Course: Cloud Computing and Storage (UF) | 1 |
| fg-45:Experiments in Distributed Computing | 1 |
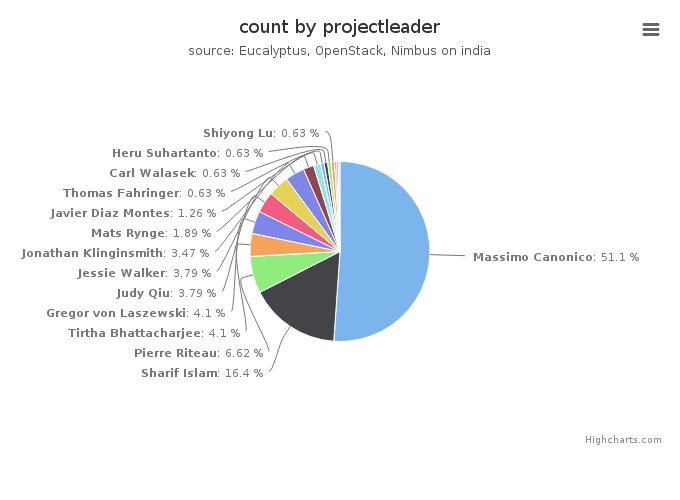
| Projectleader | Value |
|---|---|
| Massimo Canonico | 162 |
| Sharif Islam | 52 |
| Pierre Riteau | 21 |
| Tirtha Bhattacharjee | 13 |
| Gregor von Laszewski | 13 |
| Judy Qiu | 12 |
| Jessie Walker | 12 |
| Jonathan Klinginsmith | 11 |
| Mats Rynge | 6 |
| Javier Diaz Montes | 4 |
| Thomas Fahringer | 2 |
| Carl Walasek | 2 |
| Heru Suhartanto | 2 |
| Shiyong Lu | 2 |
| Shantenu Jha | 1 |
| Andy Li | 1 |
| Yong-Yeol Ahn | 1 |
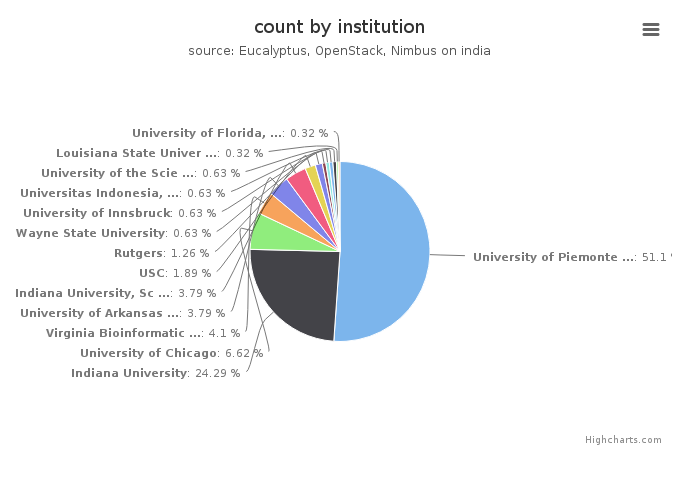
| Institution | Value |
|---|---|
| University of Piemonte Orientale, Computer Science Department | 162 |
| Indiana University | 77 |
| University of Chicago | 21 |
| Virginia Bioinformatics Institute, Virginia Polytechnic Institut | 13 |
| University of Arkansas at Pine Bluff , Computer Science | 12 |
| Indiana University, School of Informatics and Computing | 12 |
| USC | 6 |
| Rutgers | 4 |
| Wayne State University | 2 |
| University of Innsbruck | 2 |
| Universitas Indonesia, Faculty of Computer Science | 2 |
| University of the Sciences , Mathematics, Physics, and Statistic | 2 |
| Louisiana State University | 1 |
| University of Florida, Department of Electrical and Computer Eng | 1 |
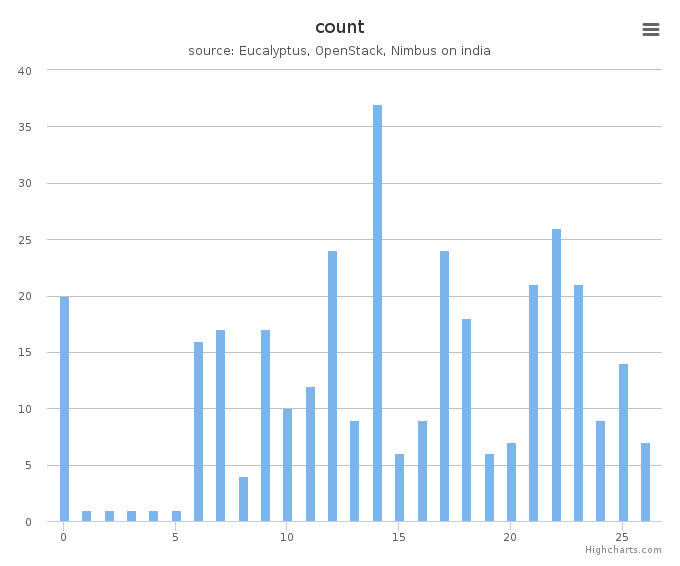
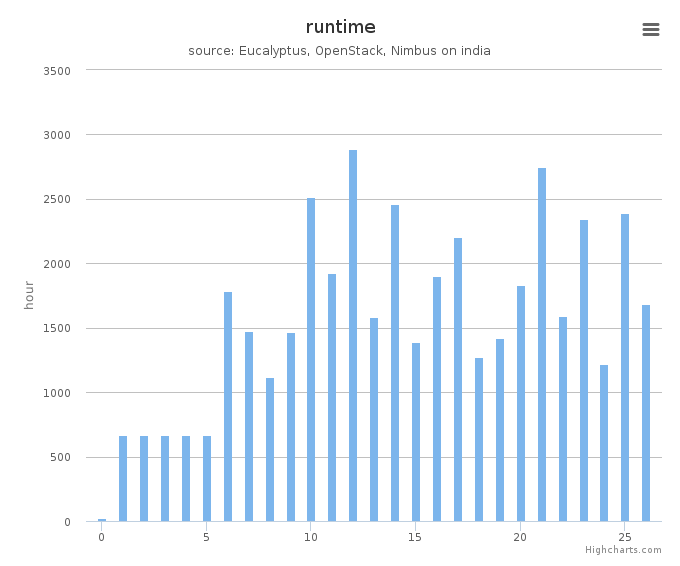
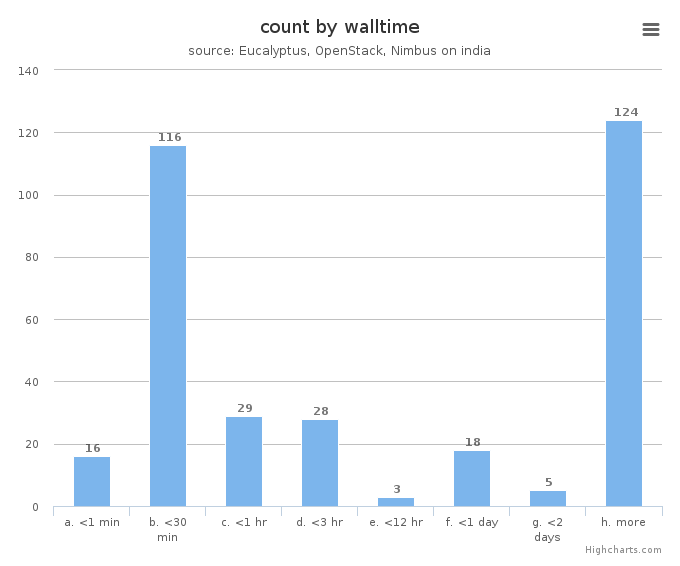
System information shows utilization distribution as to VMs count and wall time. Each cluster represents a compute node.