|
|
FutureGrid Cloud Metric |
|
|
FutureGrid Cloud Metric |
Period: July 01 – July 31, 2014
Cloud(IaaS): nimbus, openstack
Hostname: alamo
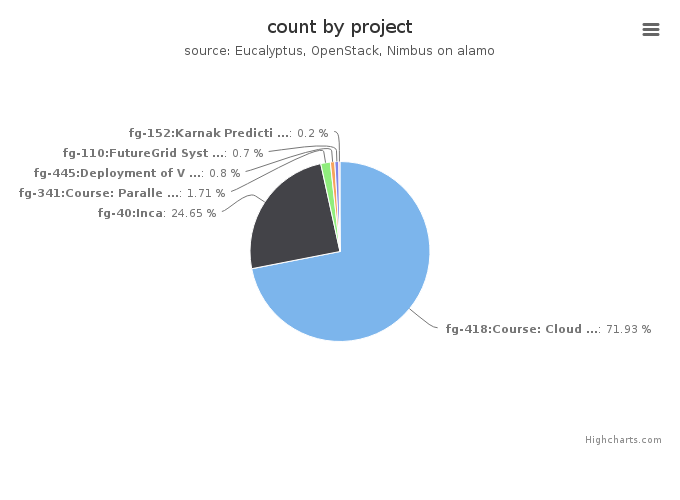
| Project | Value |
|---|---|
| fg-418:Course: Cloud Computing Class - fourth edition | 715 |
| fg-40:Inca | 245 |
| fg-341:Course: Parallel Computing | 17 |
| fg-445:Deployment of Virtual Clusters on a Commercial Cloud Platform for Molecular Docking | 8 |
| fg-110:FutureGrid Systems Development | 7 |
| fg-152:Karnak Prediction Service | 2 |
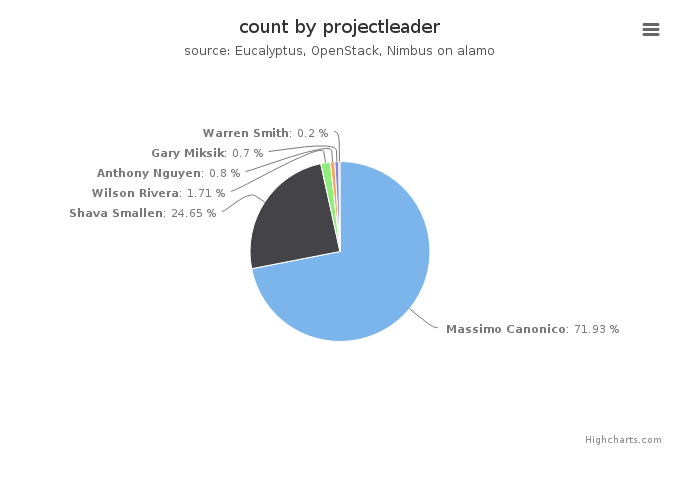
| Projectleader | Value |
|---|---|
| Massimo Canonico | 715 |
| Shava Smallen | 245 |
| Wilson Rivera | 17 |
| Anthony Nguyen | 8 |
| Gary Miksik | 7 |
| Warren Smith | 2 |

| Institution | Value |
|---|---|
| University of Piemonte Orientale, Computer Science Department | 715 |
| UC San Diego | 245 |
| University of Puerto Rico, Electrical and Computer Emgineering D | 17 |
| University of California, San Diego, PRIME/PRAGMA | 8 |
| Indiana University | 7 |
| University of Texas at Austin | 2 |
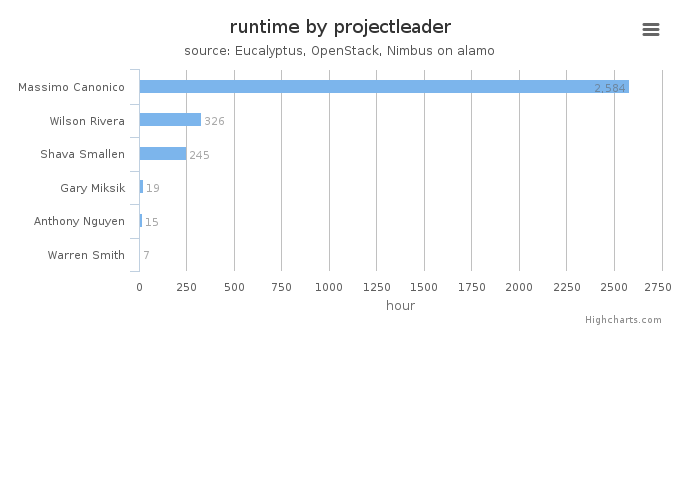
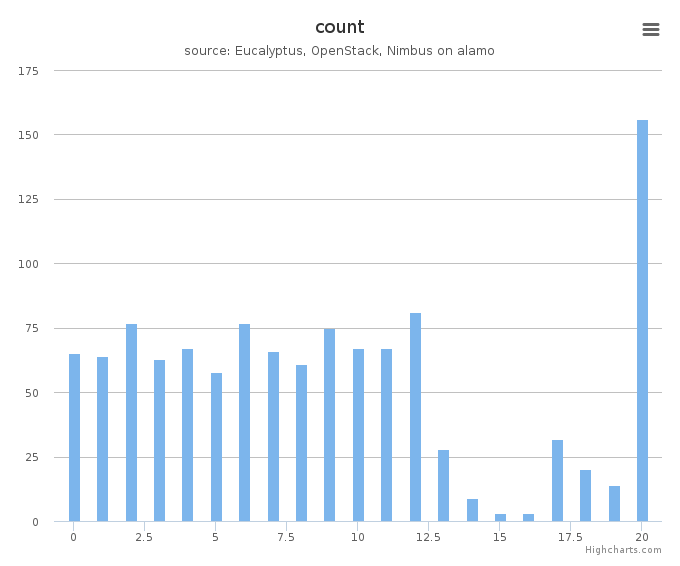
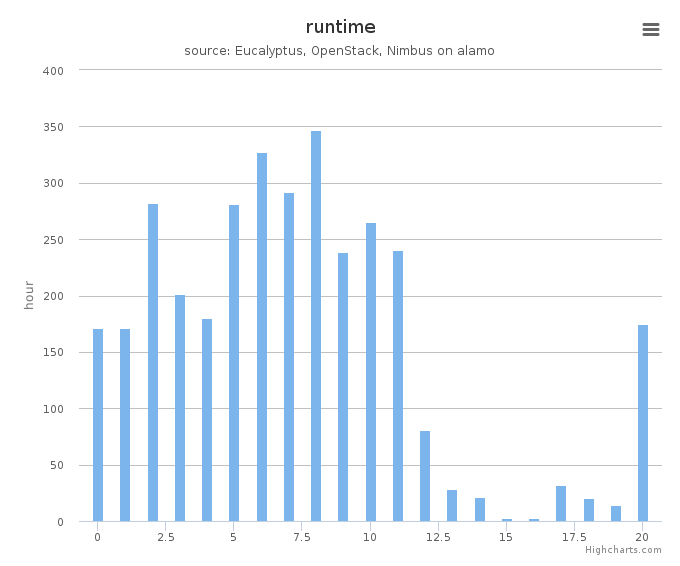
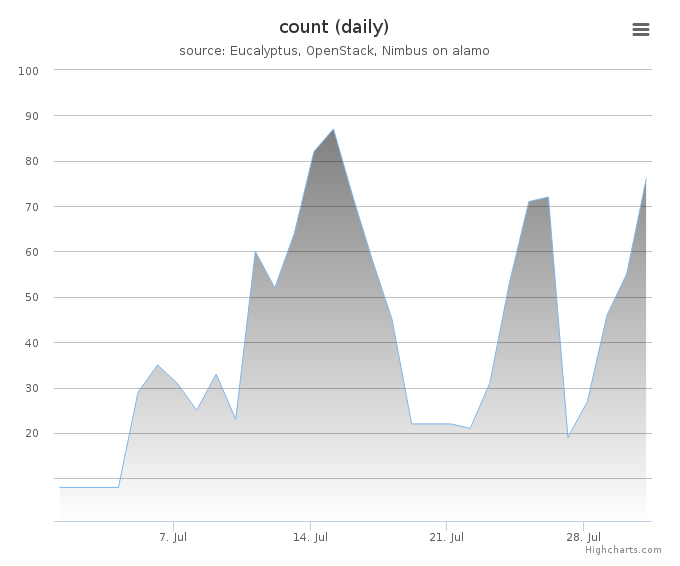
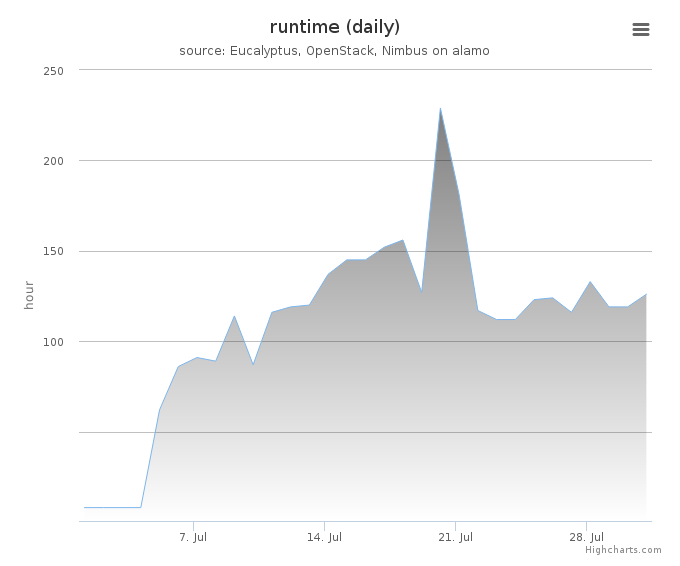
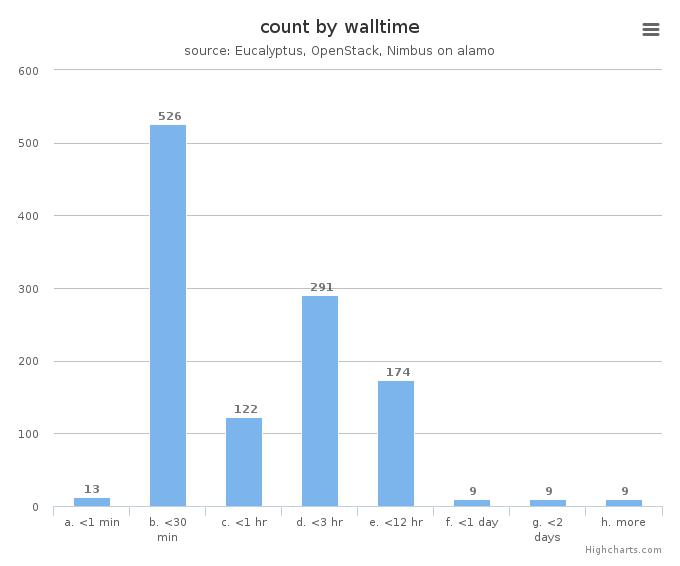
System information shows utilization distribution as to VMs count and wall time. Each cluster represents a compute node.