|
|
FutureGrid Cloud Metric |
|
|
FutureGrid Cloud Metric |
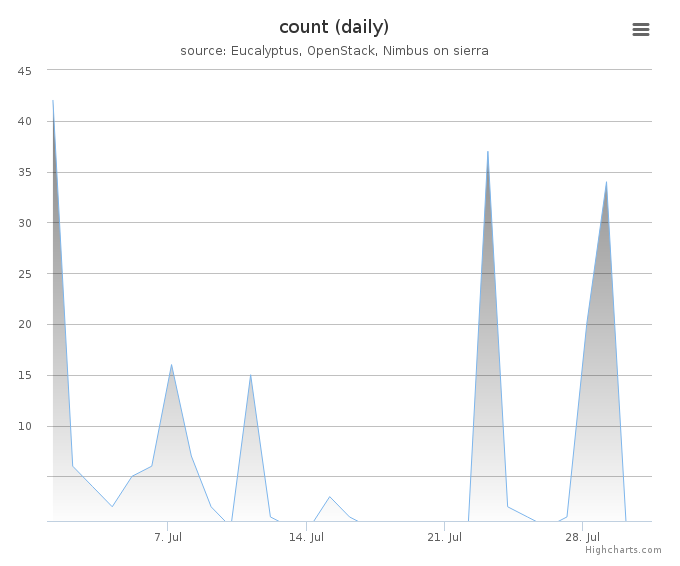
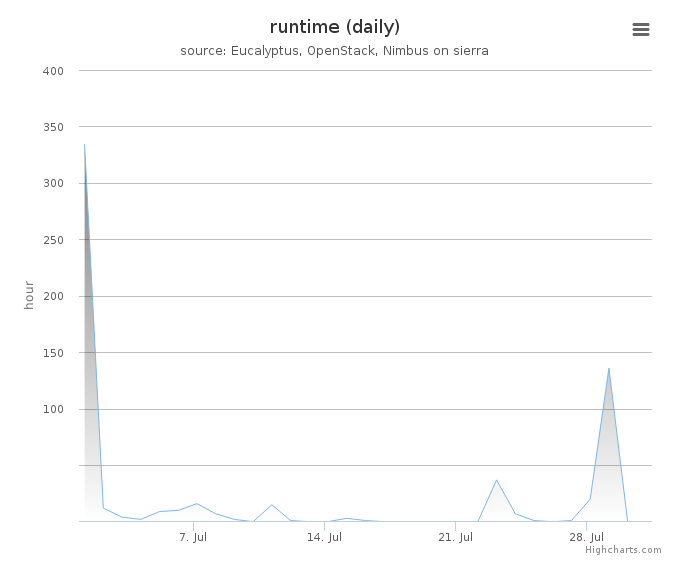
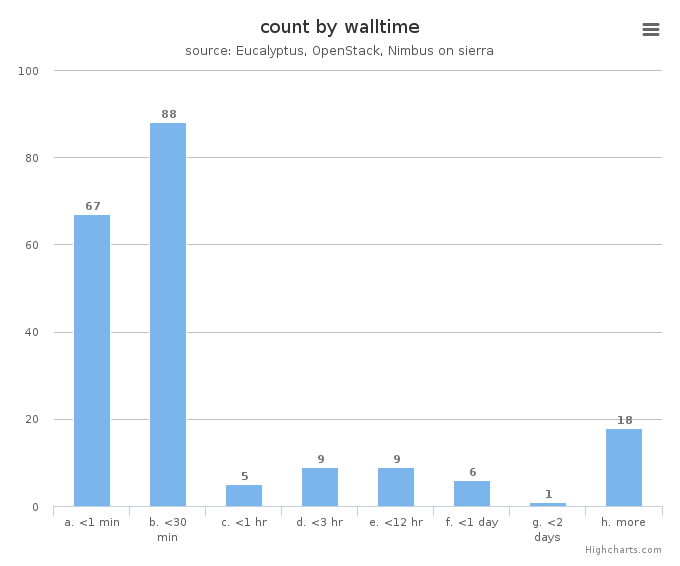
Period: July 01 – July 31, 2014
Cloud(IaaS): nimbus, openstack, eucalyptus
Hostname: sierra
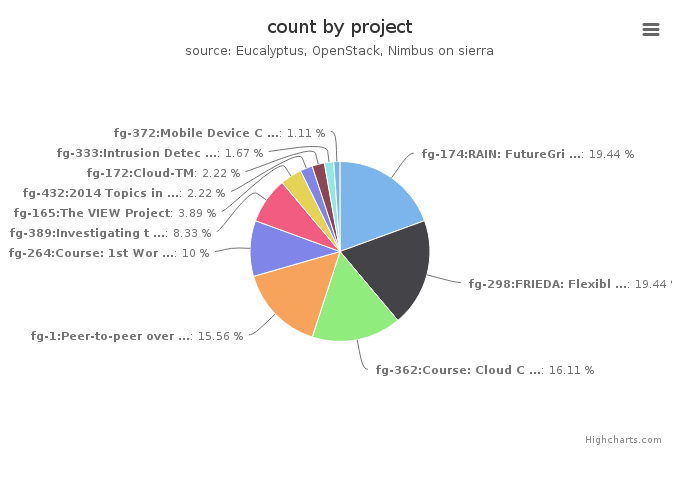
| Project | Value |
|---|---|
| fg-174:RAIN: FutureGrid Dynamic provisioning Framework | 35 |
| fg-298:FRIEDA: Flexible Robust Intelligent Elastic Data Management | 35 |
| fg-362:Course: Cloud Computing and Storage (UF) | 29 |
| fg-1:Peer-to-peer overlay networks and applications in virtual networks and virtual clusters | 28 |
| fg-264:Course: 1st Workshop on bioKepler Tools and Its Applications | 18 |
| fg-389:Investigating the Apache Big Data Stack | 15 |
| fg-165:The VIEW Project | 7 |
| fg-432:2014 Topics in Parallel Computation | 4 |
| fg-172:Cloud-TM | 4 |
| fg-333:Intrusion Detection and Prevention for Infrastructure as a Service Cloud Computing System | 3 |
| fg-372:Mobile Device Computation Offloading over SocialVPNs | 2 |
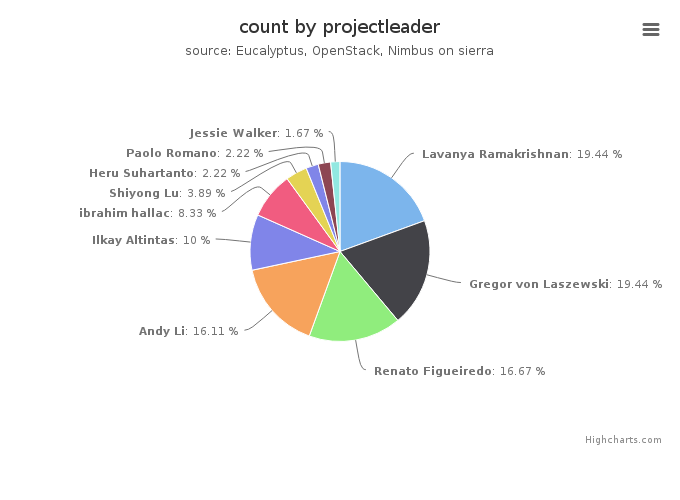
| Projectleader | Value |
|---|---|
| Lavanya Ramakrishnan | 35 |
| Gregor von Laszewski | 35 |
| Renato Figueiredo | 30 |
| Andy Li | 29 |
| Ilkay Altintas | 18 |
| ibrahim hallac | 15 |
| Shiyong Lu | 7 |
| Heru Suhartanto | 4 |
| Paolo Romano | 4 |
| Jessie Walker | 3 |

| Institution | Value |
|---|---|
| Indiana University | 35 |
| Lawrence Berkeley National Lab | 35 |
| University of Florida, Department of Electrical and Computer Eng | 29 |
| University of Florida | 28 |
| UCSD | 18 |
| Firat University, Computer Science Department | 15 |
| Wayne State University | 7 |
| Universitas Indonesia, Faculty of Computer Science | 4 |
| INESC ID | 4 |
| University of Arkansas at Pine Bluff , Computer Science | 3 |
| University of Florida, Electrical and Computer Engineering | 2 |
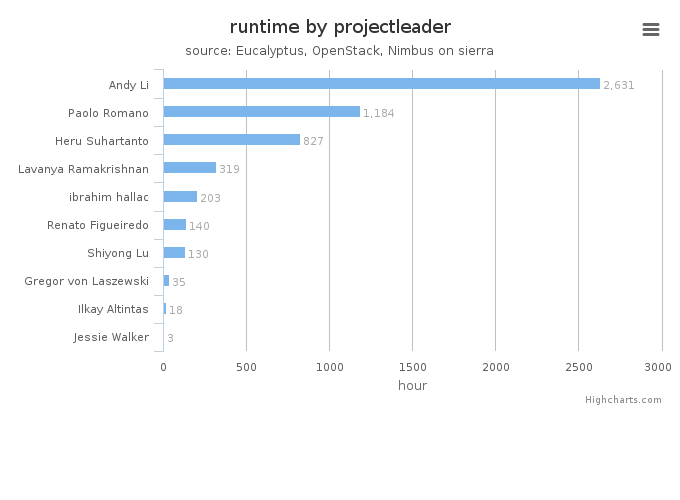
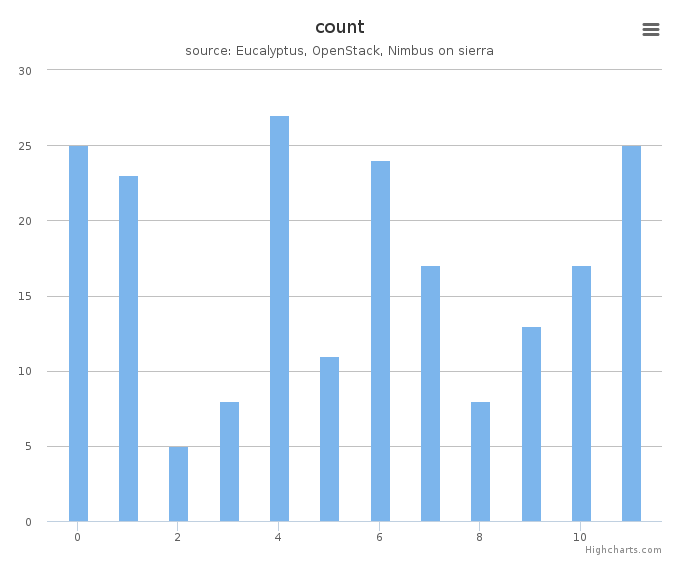
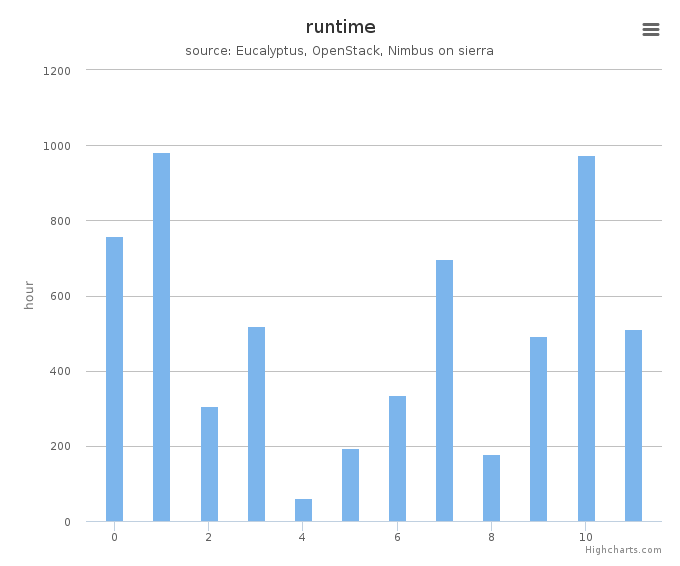
System information shows utilization distribution as to VMs count and wall time. Each cluster represents a compute node.