|
|
FutureGrid Cloud Metric |
|
|
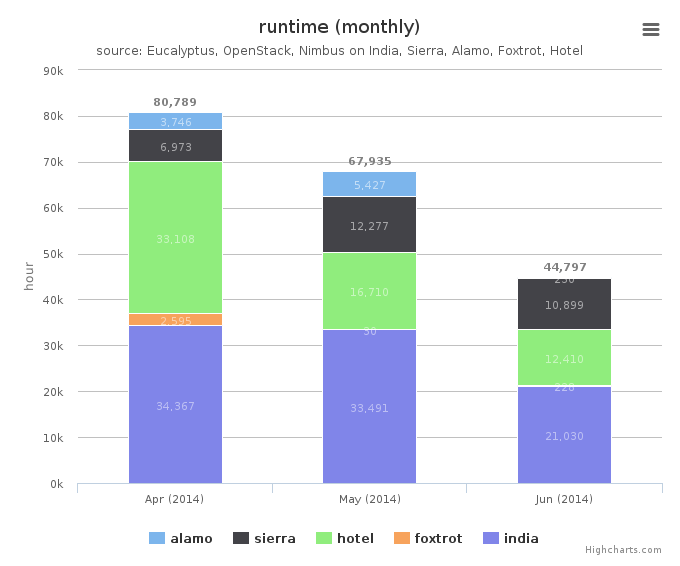
FutureGrid Cloud Metric |
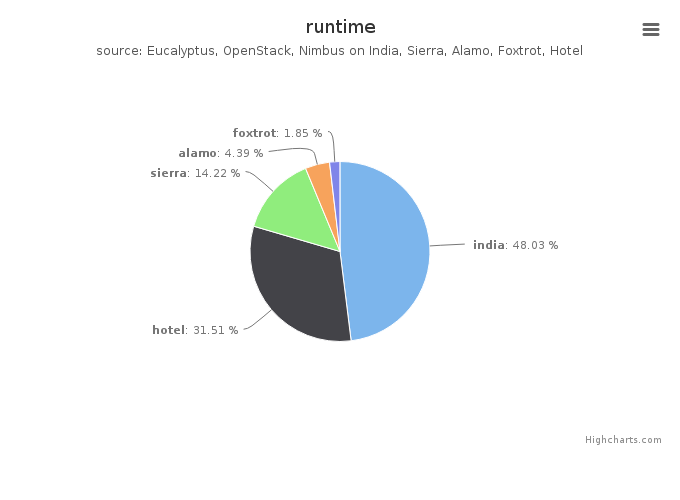
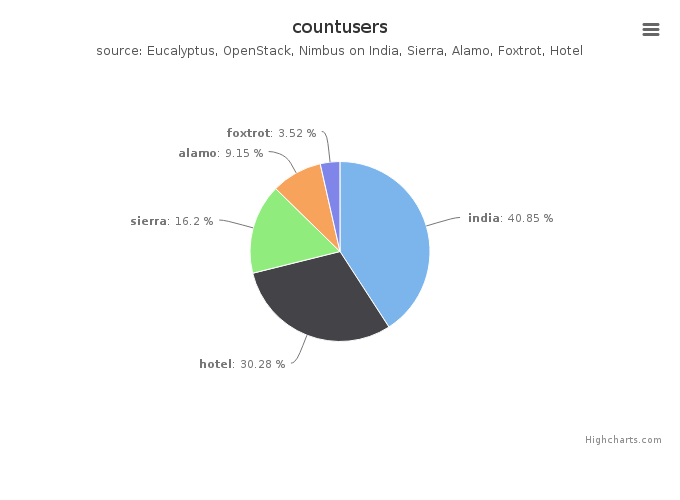
Period: April 01 – June 30, 2014
| Total | Value |
|---|---|
| india | 102905.0 |
| hotel | 67499.0 |
| sierra | 30463.0 |
| alamo | 9403.0 |
| foxtrot | 3974.0 |
Period: April 01 – June 30, 2014
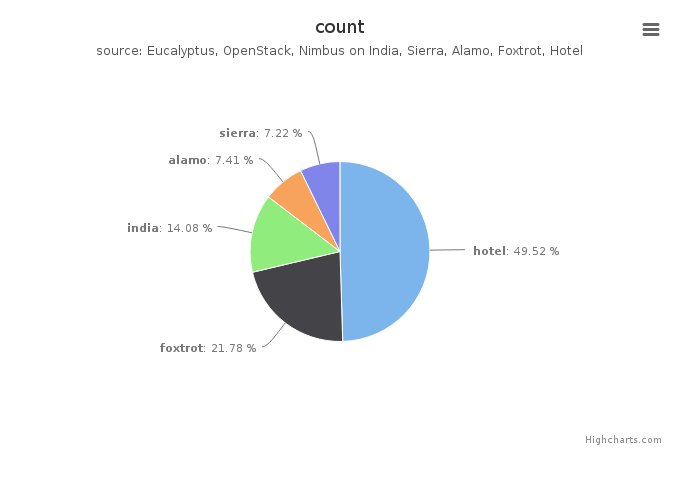
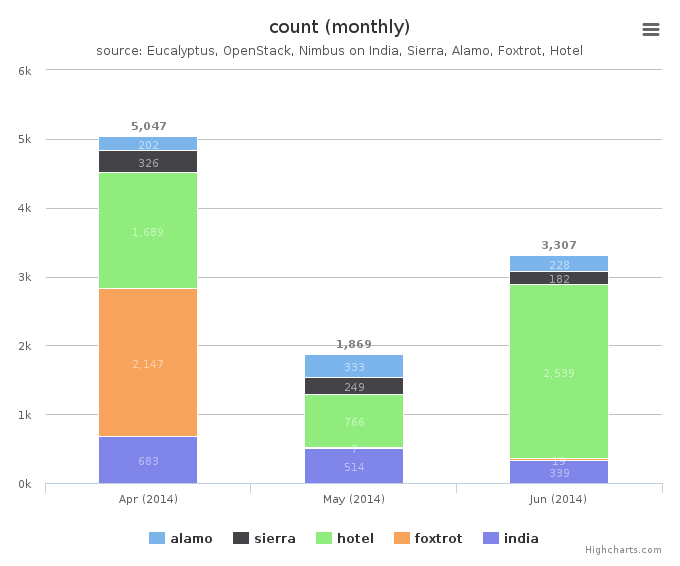
Period: April 01 – June 30, 2014
| Total | Value |
|---|---|
| hotel | 4941 |
| foxtrot | 2173 |
| india | 1405 |
| alamo | 739 |
| sierra | 720 |
Period: April 01 – June 30, 2014
Period: April 01 – June 30, 2014
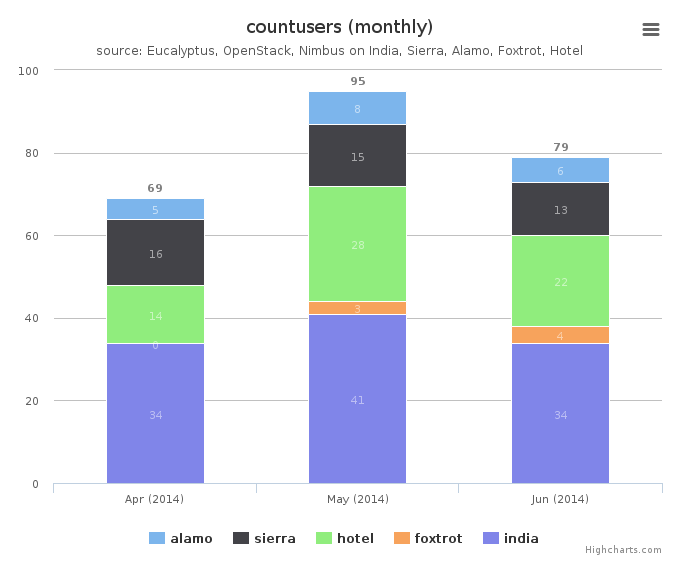
| Total | Value |
|---|---|
| india | 58 |
| hotel | 43 |
| sierra | 23 |
| alamo | 13 |
| foxtrot | 5 |
Period: April 01 – June 30, 2014