|
|
FutureGrid Cloud Metric |
|
|
FutureGrid Cloud Metric |
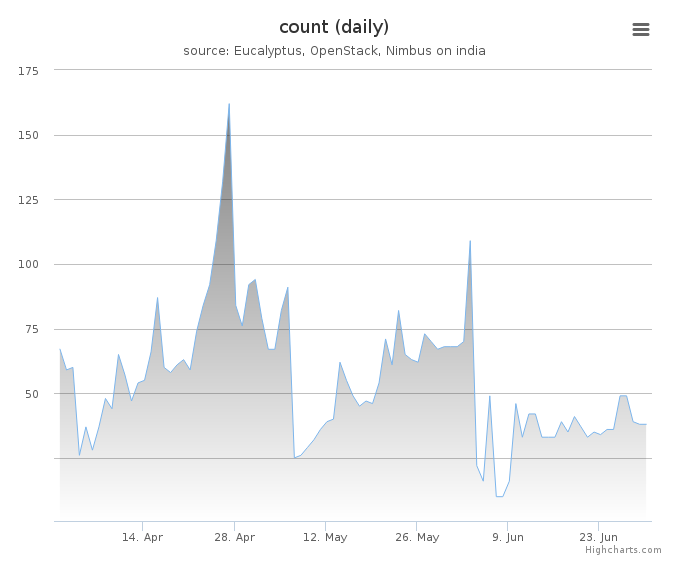
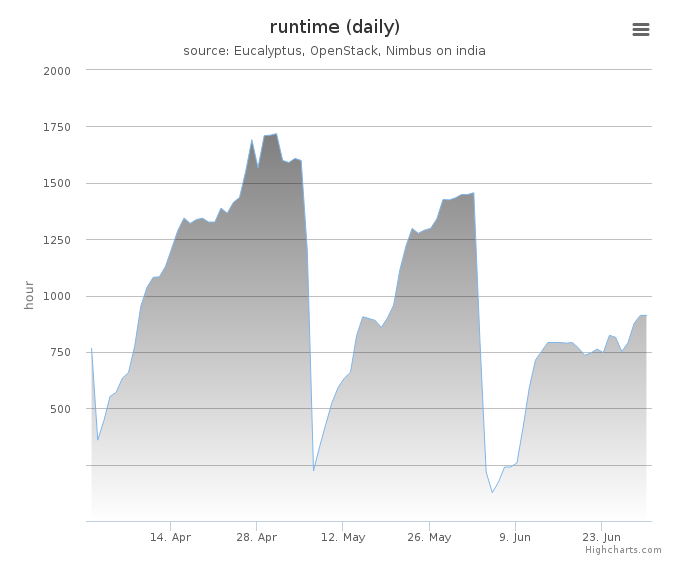
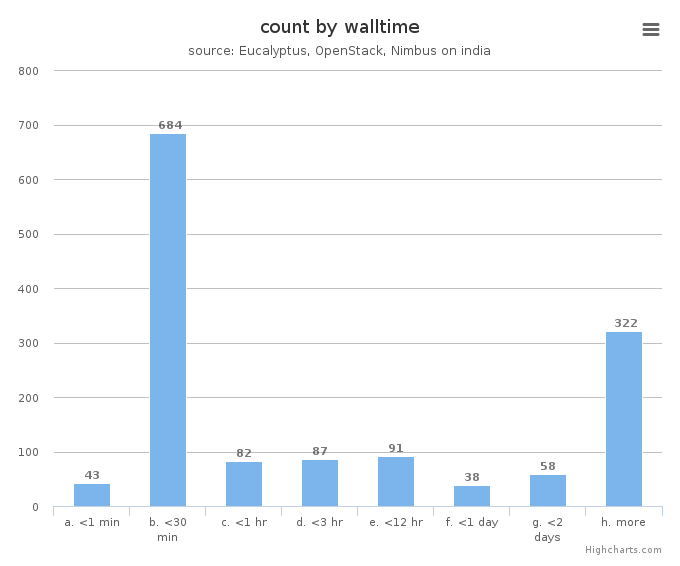
Period: April 01 – June 30, 2014
Cloud(IaaS): openstack, eucalyptus
Hostname: india
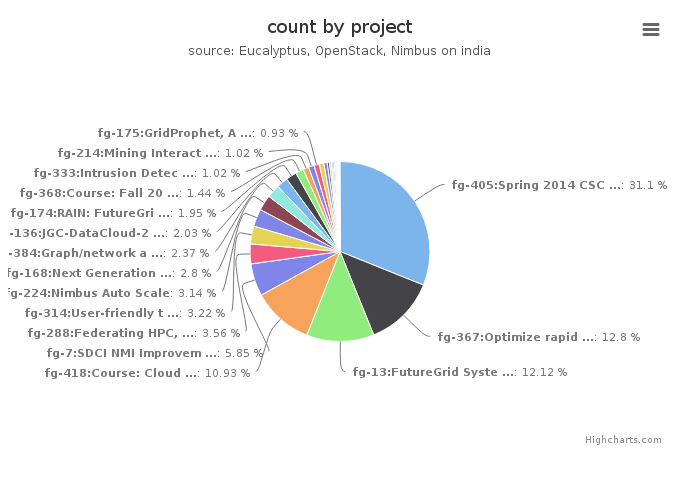
| Project | Value |
|---|---|
| fg-405:Spring 2014 CSCI-B649 Cloud Computing MOOC for residential and online students | 367 |
| fg-367:Optimize rapid deployment and updating of VM images at the remote compute cluster | 151 |
| fg-13:FutureGrid Systems Development and Prototyping | 143 |
| fg-418:Course: Cloud Computing Class - fourth edition | 129 |
| fg-7:SDCI NMI Improvement: Pegasus: From Concept to Execution- - -Mapping Scientific Workflows onto the National Cyberinfrastructure | 69 |
| fg-288:Federating HPC, Cyberinfrastructure and Clouds using CometCloud | 42 |
| fg-314:User-friendly tools to play with cloud platforms | 38 |
| fg-224:Nimbus Auto Scale | 37 |
| fg-168:Next Generation Sequencing in the Cloud | 33 |
| fg-384:Graph/network analysis Resource manager | 28 |
| fg-136:JGC-DataCloud-2012 paper experiments | 24 |
| fg-174:RAIN: FutureGrid Dynamic provisioning Framework | 23 |
| fg-368:Course: Fall 2013 P434 Distributed Systems Undergraduate Course | 17 |
| fg-333:Intrusion Detection and Prevention for Infrastructure as a Service Cloud Computing System | 12 |
| fg-214:Mining Interactions between Network Community Structure and Information Diffusion | 12 |
| fg-175:GridProphet, A workflow execution time prediction system for the Grid | 11 |
| fg-362:Course: Cloud Computing and Storage (UF) | 10 |
| fg-382:Reliability Analysis using Hadoop and MapReduce | 7 |
| fg-316:Course: Cloud Computing Class - third edition | 5 |
| fg-10:TeraGrid XD TIS(Technology Insertion Service) Technology Evaluation Laboratory | 4 |
| fg-1:Peer-to-peer overlay networks and applications in virtual networks and virtual clusters | 3 |
| fg-165:The VIEW Project | 3 |
| fg-248:Geophysical fluid dynamics education and research | 3 |
| fg-411:ILS-Z604 Big Data Analytics for Web and Text - SP14 Group #2 | 2 |
| fg-432:2014 Topics in Parallel Computation | 2 |
| fg-110:FutureGrid Systems Development | 1 |
| fg-20:Development of an information service for FutureGrid | 1 |
| fg-42:SAGA | 1 |
| fg-45:Experiments in Distributed Computing | 1 |
| fg-372:Mobile Device Computation Offloading over SocialVPNs | 1 |
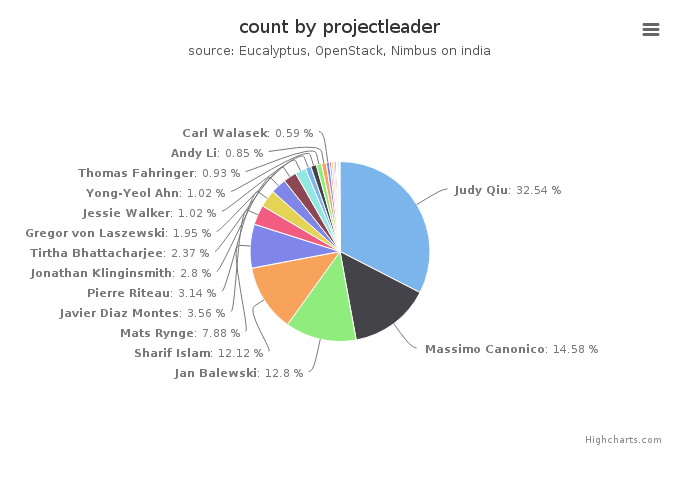
| Projectleader | Value |
|---|---|
| Judy Qiu | 384 |
| Massimo Canonico | 172 |
| Jan Balewski | 151 |
| Sharif Islam | 143 |
| Mats Rynge | 93 |
| Javier Diaz Montes | 42 |
| Pierre Riteau | 37 |
| Jonathan Klinginsmith | 33 |
| Tirtha Bhattacharjee | 28 |
| Gregor von Laszewski | 23 |
| Jessie Walker | 12 |
| Yong-Yeol Ahn | 12 |
| Thomas Fahringer | 11 |
| Andy Li | 10 |
| Carl Walasek | 7 |
| Renato Figueiredo | 4 |
| John Lockman | 4 |
| Glenn Flierl | 3 |
| Shiyong Lu | 3 |
| Shantenu Jha | 2 |
| Heru Suhartanto | 2 |
| Trevor Edelblute | 2 |
| Gary Miksik | 1 |
| Hyungro Lee | 1 |
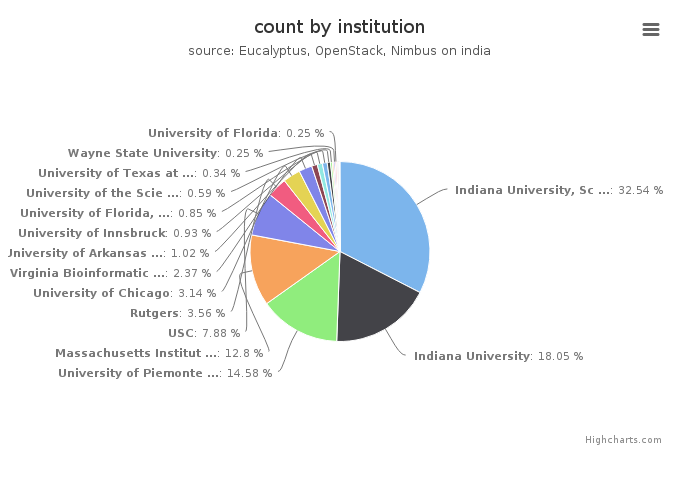
| Institution | Value |
|---|---|
| Indiana University, School of Informatics and Computing | 384 |
| Indiana University | 213 |
| University of Piemonte Orientale, Computer Science Department | 172 |
| Massachusetts Institute of Technology, Laboratory for Nuclear Sc | 151 |
| USC | 93 |
| Rutgers | 42 |
| University of Chicago | 37 |
| Virginia Bioinformatics Institute, Virginia Polytechnic Institut | 28 |
| University of Arkansas at Pine Bluff , Computer Science | 12 |
| University of Innsbruck | 11 |
| University of Florida, Department of Electrical and Computer Eng | 10 |
| University of the Sciences , Mathematics, Physics, and Statistic | 7 |
| University of Texas at Austin | 4 |
| Massachusetts Institute of Technology | 3 |
| Wayne State University | 3 |
| University of Florida | 3 |
| Louisiana State University | 2 |
| Indiana University, Department of Information & Library Science, | 2 |
| Universitas Indonesia, Faculty of Computer Science | 2 |
| University of Florida, Electrical and Computer Engineering | 1 |
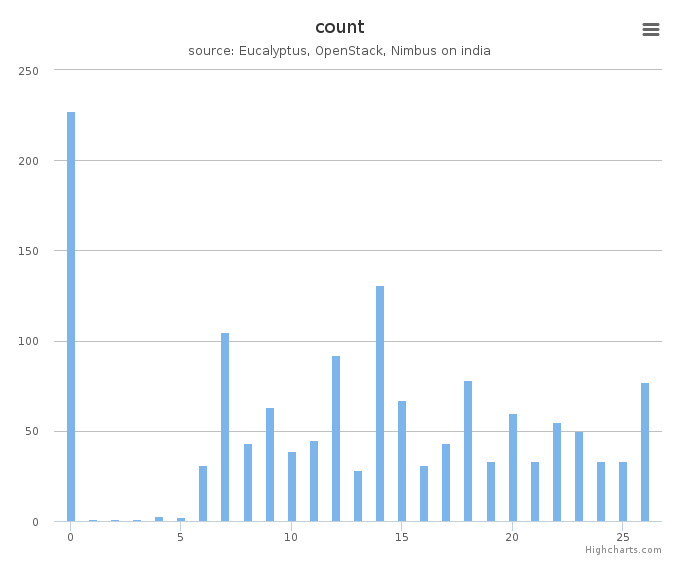
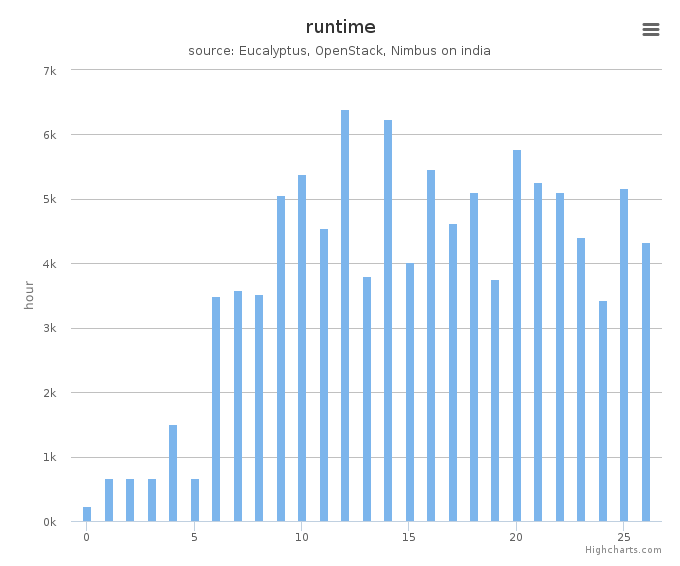
System information shows utilization distribution as to VMs count and wall time. Each cluster represents a compute node.