Download & Install
Notice you will use Cgl Course Builder instead of the google course builder the instruction below mentioned.
1.Download and install Python 2.7 2.Download and install Google App Engine 3.Download Cgl Mooc Builder 4.Run Cgl Course Builder
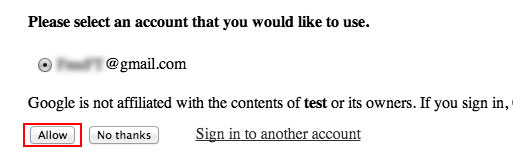
1.Register your Course Builder with Google
2.Set up an app-specific password
3.Deploy your Course
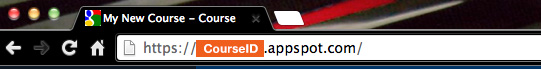
1.On your browser, type "CourseID.appspot.com". CourseID is the word after "application:" in the app.yaml file in coursebuilder folder.
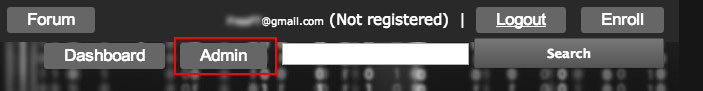
2.Log in as an Administrator


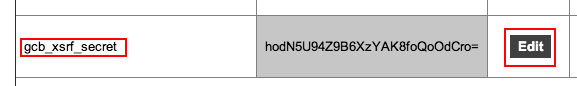
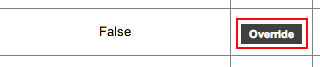
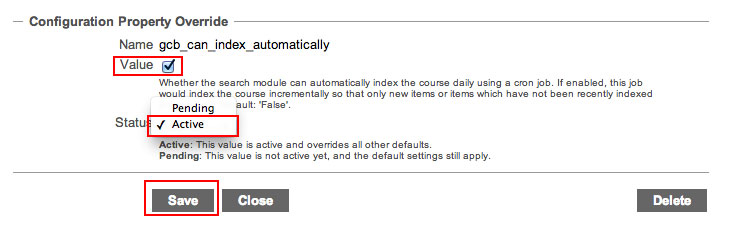
4.Enable some flags for course progress bar, and capturing other course data.
To change one flag's value, follow the following steps:
Course Management
1.On your browser, type "CourseID.appspot.com". CourseID is the word after "application:" in the app.yaml file in coursebuilder folder.
2.Log in as an Administrator
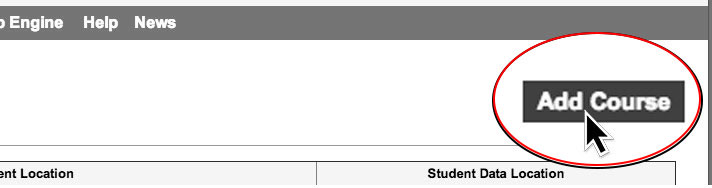
1.On the admin interface, click "Add Course" button.
2.Enter a name and a title for your course, also provide a admin email address.
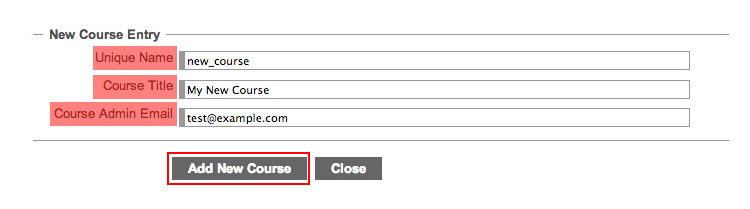
3.Now you created a new course
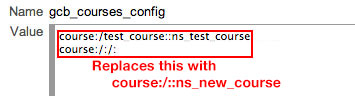
4.Change namespace setting
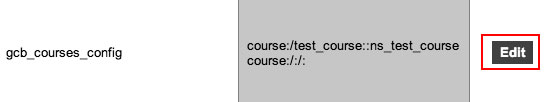
Replace all values with "course"/""ns_new_course"
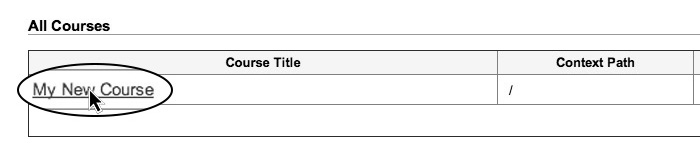
On the admin panel, you should see only one course.

1.On the admin page,click the course title to go to the course dash board

2.On the course dash board, click settings.

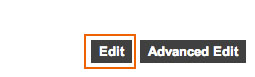
3.On the settings page, click "edit" button on the right.
4.Check admin email address and change settings as shown below
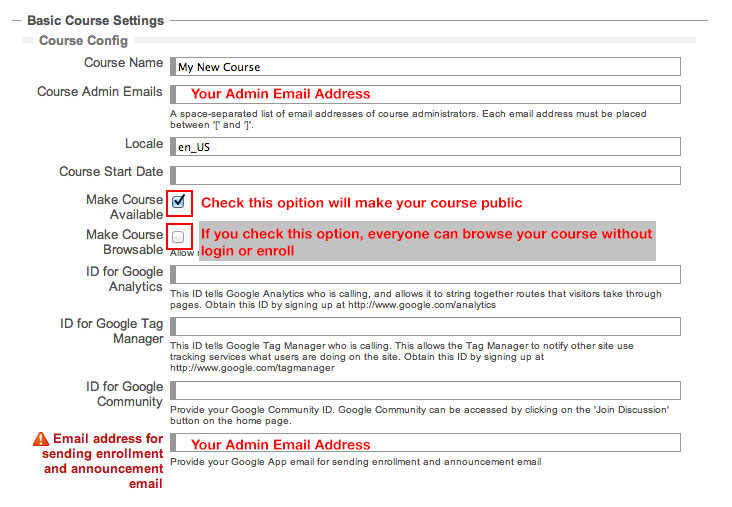
5.Scroll down the page and fill in information.
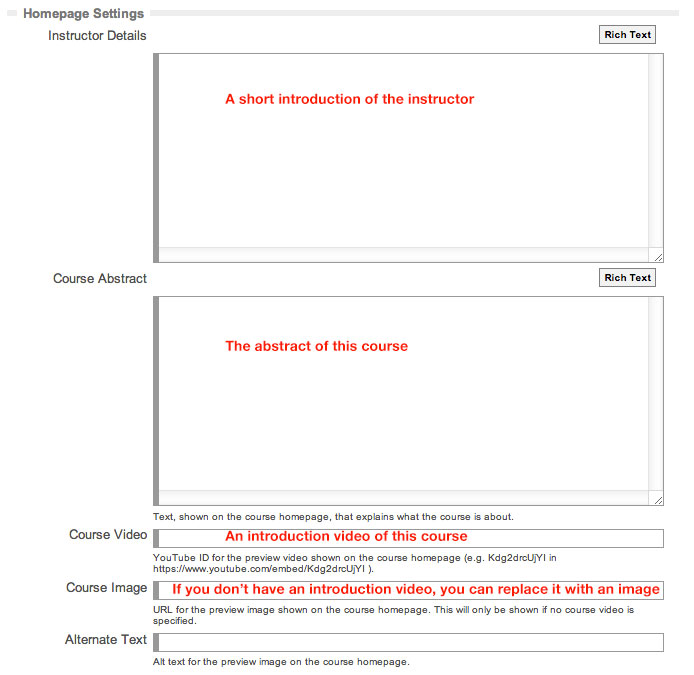
6.After you are done, click "Save" at the bottom.
7.Now if you go back to your course website "CourseID.appspot.com". You will see those changes.
1.On the admin page,click the course title to go to the course dash board
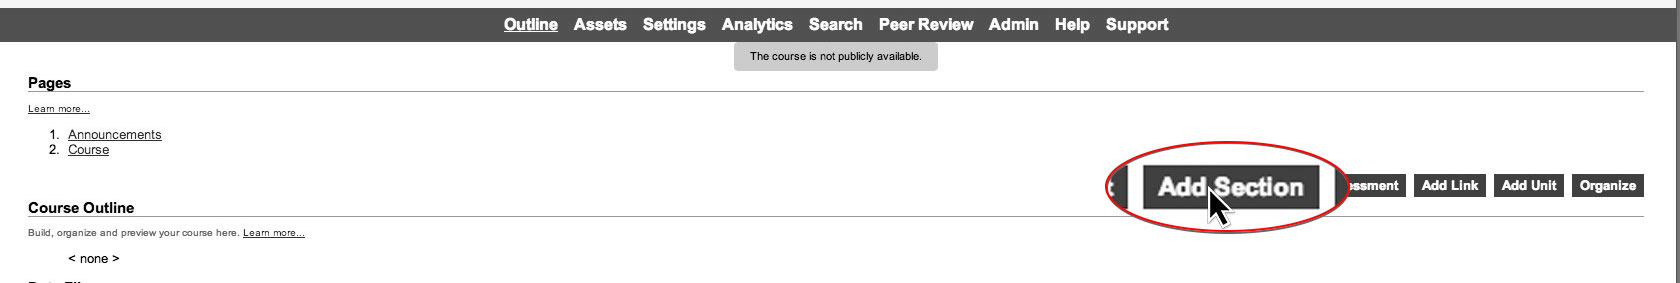
2.On the course dash board, click "Add Section"
3.Complete the information as below
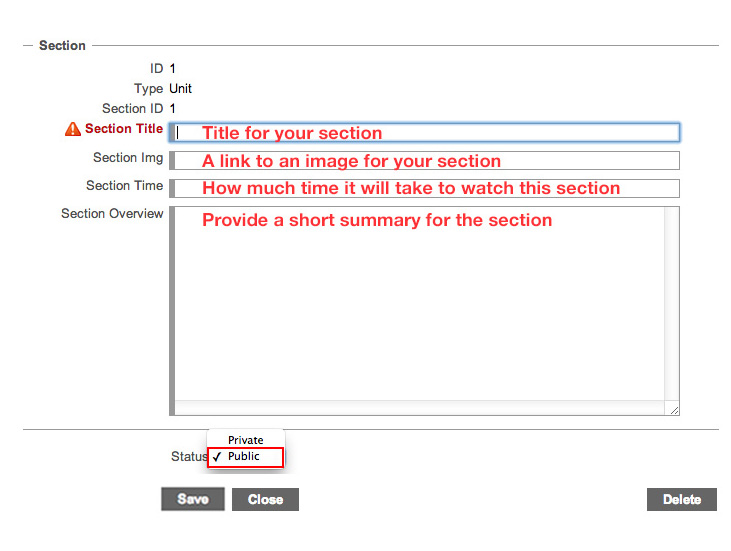
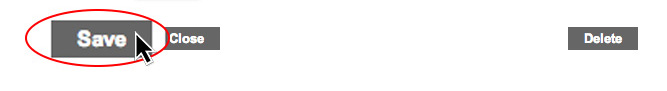
4.After you complete the form, click save
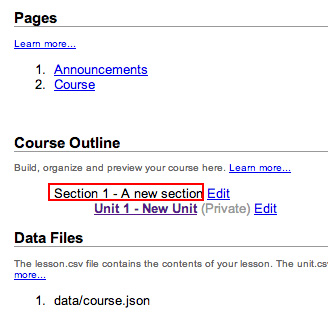
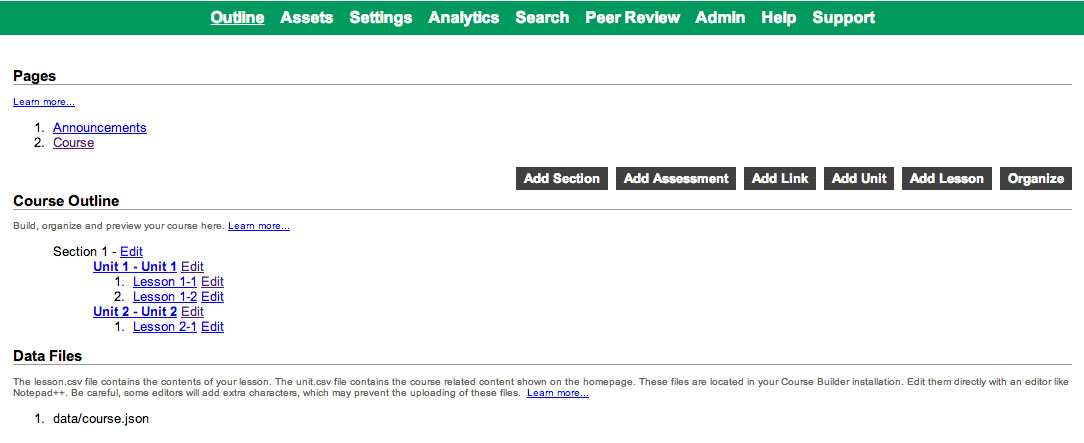
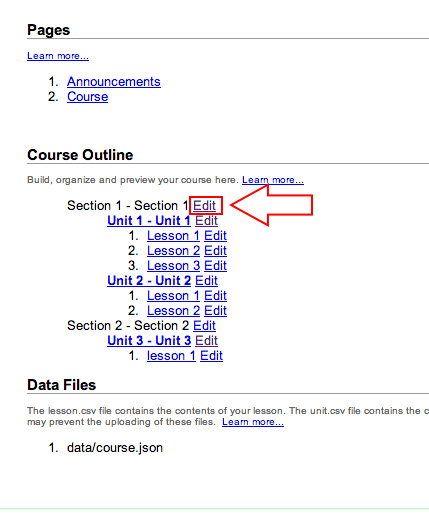
5.Click outline and go back to the dash board

6.In the "Course Outline", you can find the section you just created
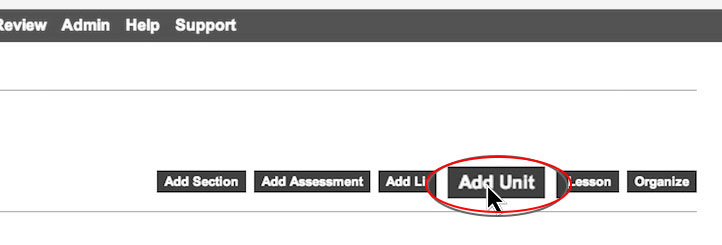
1.On the course dash board, click "Add Unit"
2.Complete the form
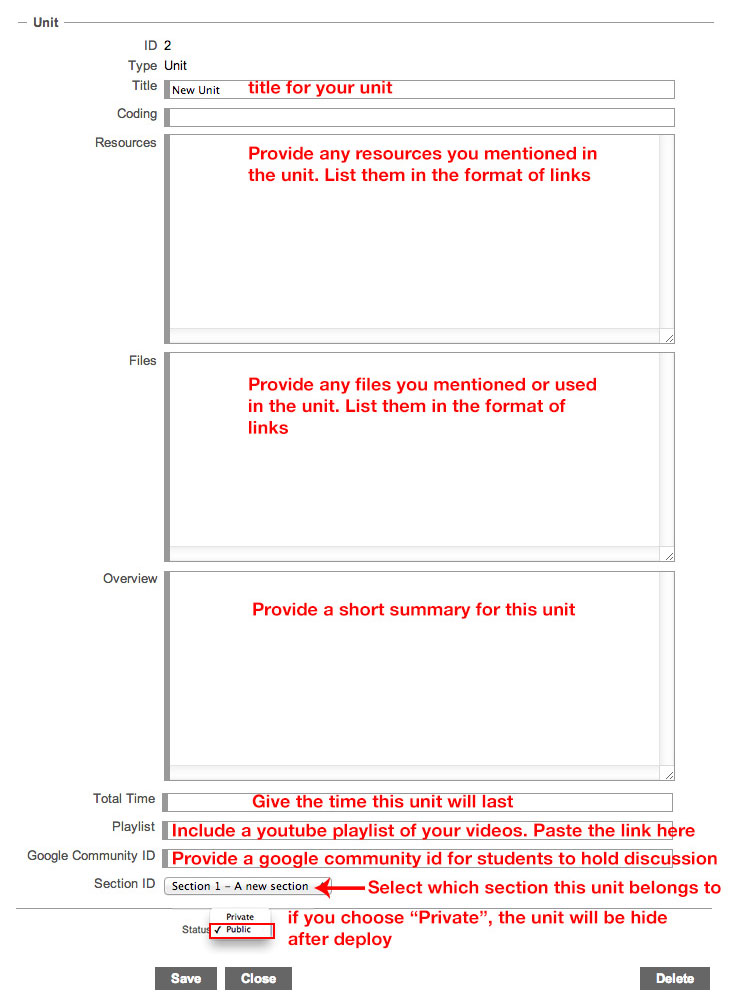
3.Click "Save"

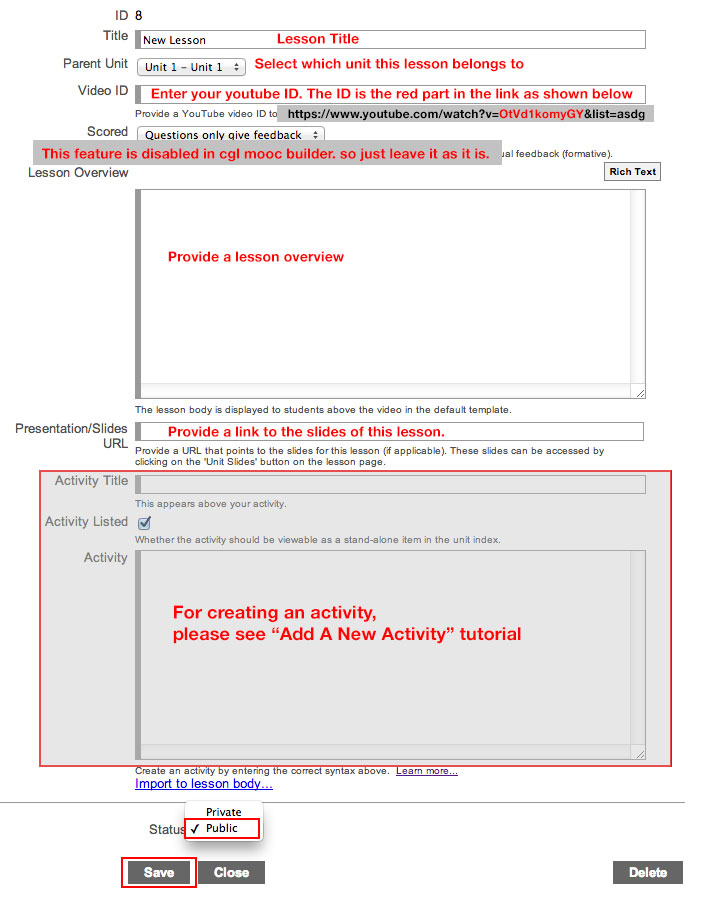
1.On the course dash board, click "Add Lesson"

2.Fill the form follow the instruction below
1.Go to course dash board
2.Click "Edit" button on the right of a lesson
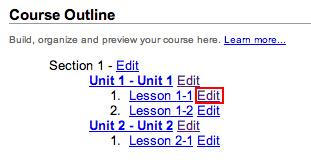
3.Construct the activity in the "Activity" text area.
For detail of creating a activity, please refer to this link:
https://code.google.com/p/course-builder/wiki/CreateActivities#Writing_activitiesHere is one example:
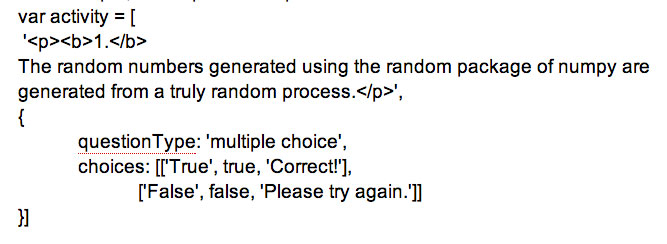
4.Click "Save".
5.View the lesson page to see the activity.
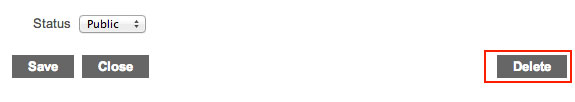
1.On course dash board, click "Edit" for the component you want delete
2.Click "Delete"
1.Go to the Course Builder admin page. Typically it is hosted on port number 8080.
2.Click on Settings
3. Override the following settings and enable it to True
gcb_can_persist_page_events
gcb_can_persist_activity_events
Course Data
1.Download data using the command
>python tools/etl/coursedata.py download datastore / your_app_id your_app_id.appspot.com --archive_path your_file_path.zip --datastore_type Student
2.Unzip your_file_path.zip downloaded by using above command
3.Find a script called Parse_Students_Enrollment_Data.py in folder: coursebuilder/tools/etl
4.Edit the script using a text editor. Find TODOs in the file and edit the correct file path and filename.
5.Run the script.
The script read through each data object from the unzipped your_file_path folder and construct a csv file with students information.
6.Use MS Excel to make a pivot table
a. Select all data in the table and go to Insert -> PivotChart
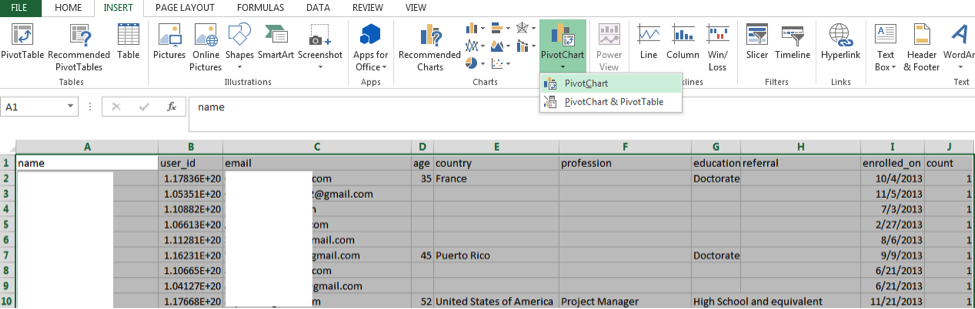
b. Check “Select a table or range” and New Worksheet. Click OK.
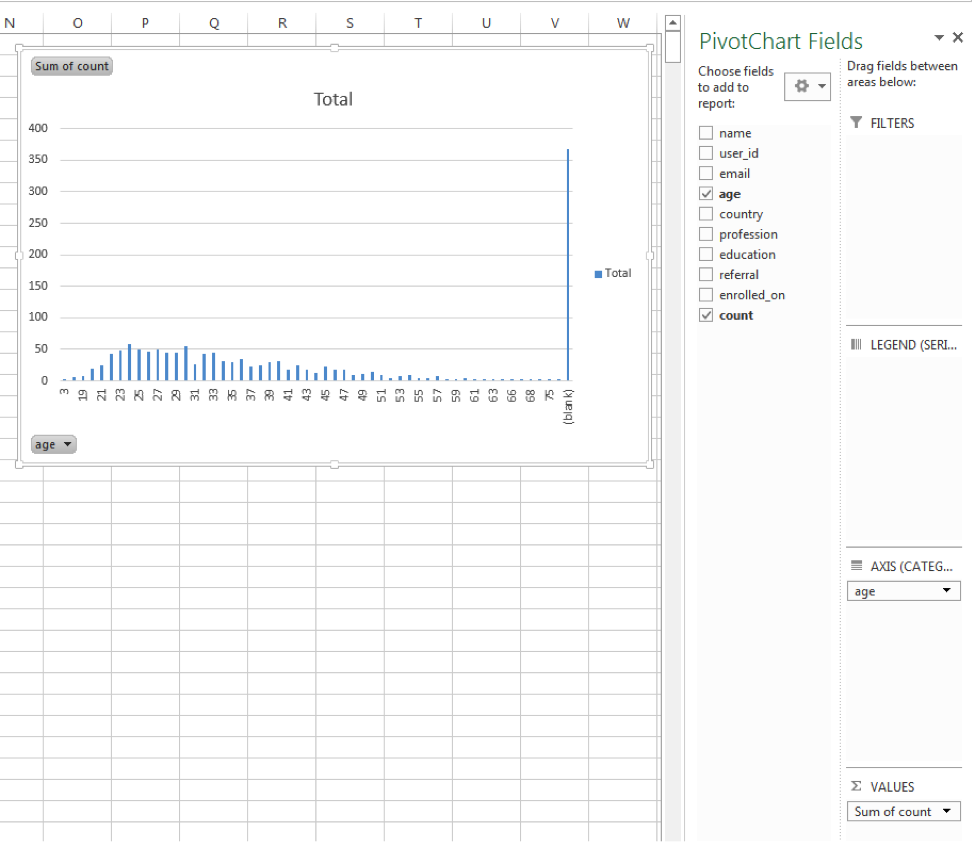
c. Find PivotChart Fields on the right column, check “age” and “count”. You should see a graph of age and count as shown below.
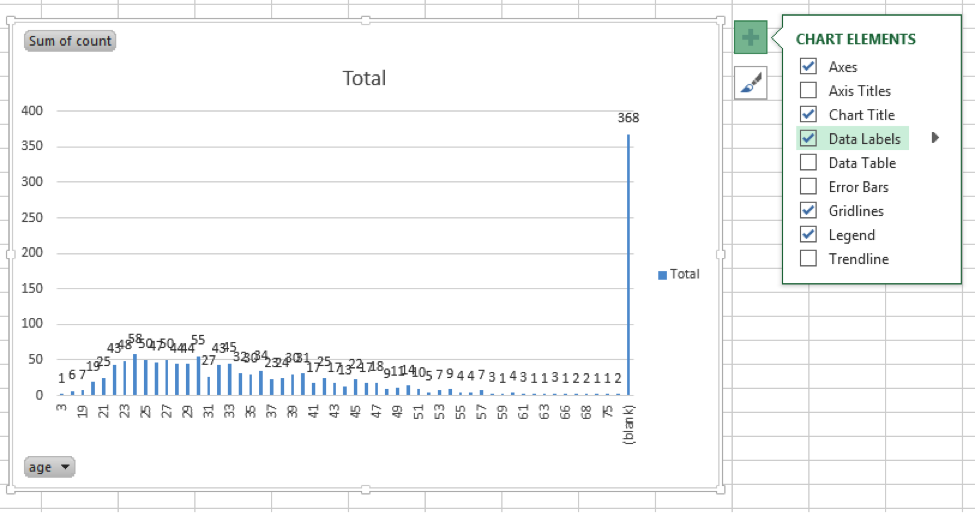
d. You can add data labels like this:
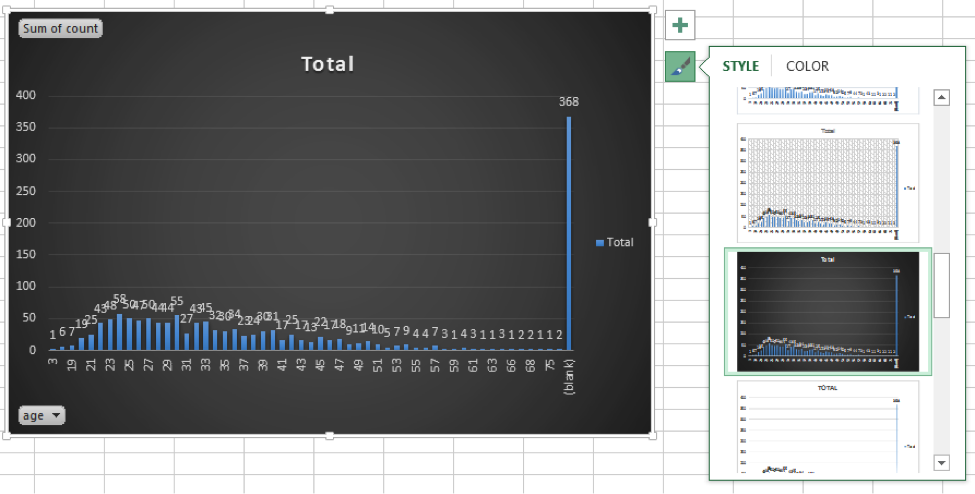
e. You can also change the color scheme
f.You can create pivot table for country, education, referral by repeating the same process from step a. to step e.
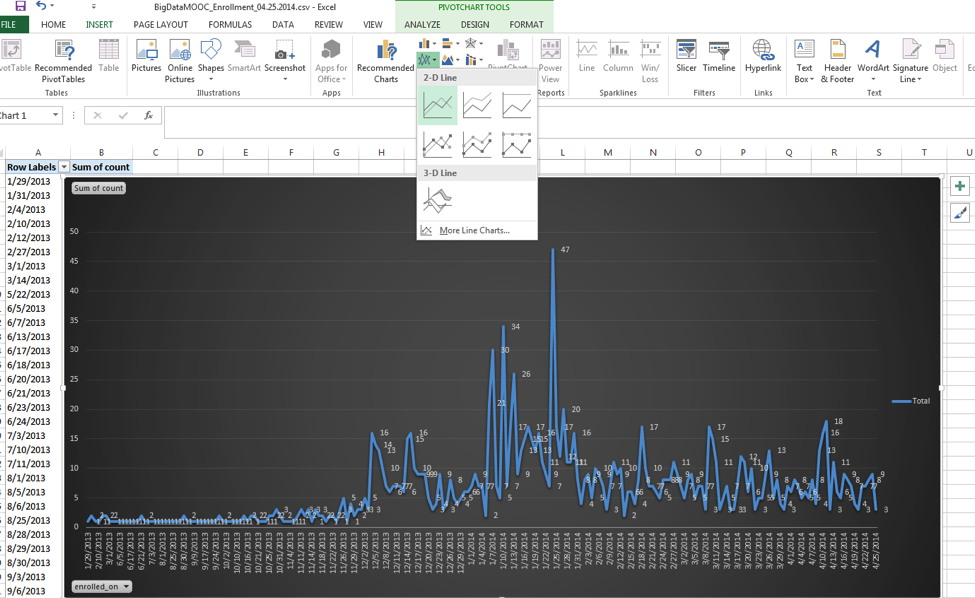
g. For the pivot table of “enrolled_on”, repeat the step from a. to e, then go to Insert -> select 2D line as shown below
h.Remember to save the file as Excel format instead of CSV.
1. You must have your database ready with appropriate tables
a. Events Table
i. user_id varchar(255)
ii. recorded_on date
iii. source varchar(255)
iv. key varchar(255)
v. duration int(11)
vi. tag varchar(45)
vii. unit_value varchar(45)
viii. lesson_value varchar(45)
ix. data text
b. Students Table
i. name varchar(60)
ii. role varchar(255)
iii. user_id varchar(255), primary key
iv. university_id varchar(100)
v. email varchar(255)
vi. university_email varchar(255)
vii. age int(11)
viii. motivation text
ix. city varchar(255)
x. state varchar(255)
xi. country varchar(255)
xii. profession varchar(255)
xiii. is_enrolled tinyint(1)
xiv. scores text
xv. organization varchar(255)
xvi. education varchar(45)
xvii. referral varchar(45)
xviii. enrolled_on date
xix. class varchar(60)
2.Edit Events_Report.py script
a. Events_Report.py is located in this folder: coursebuilder/tools/etl
b. Open Events_Report.py with a text editor such as Notepad++.
c. Find TODOs in the file and edit the correct username, email, password, database information and file path.
d. Run the script by typing python Events_Report.py
i. Events_Report.py will download Events and Students data from your Google App.
ii. It will update events data and students data into Events and Students tables; and then generate a CSV file.
iii. The result CSV file is named: Events_Report_MM.DD.YYY_HH.mm.ss.csv by default
e. Open the CSV file and use MS Excel to make pivot tables
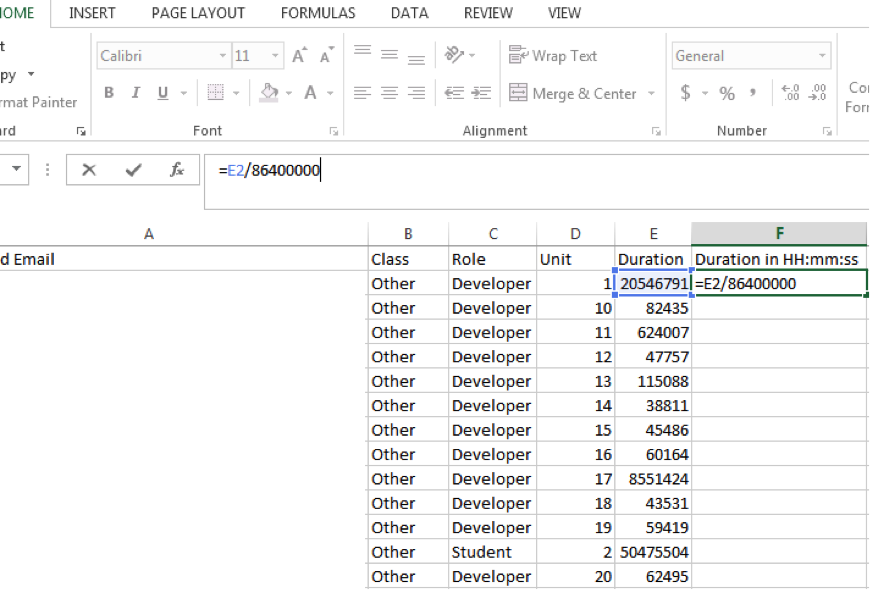
i. Create a new column named Duration in HH:mm:ss
ii. Click on Cell F2, enter function “=E2/86400000” as shown on the graph below.
iii. Move your mouse cursors to the bottom right of the cell F2, your cursor should change to a cross. Double click to apply the change to the entire column.
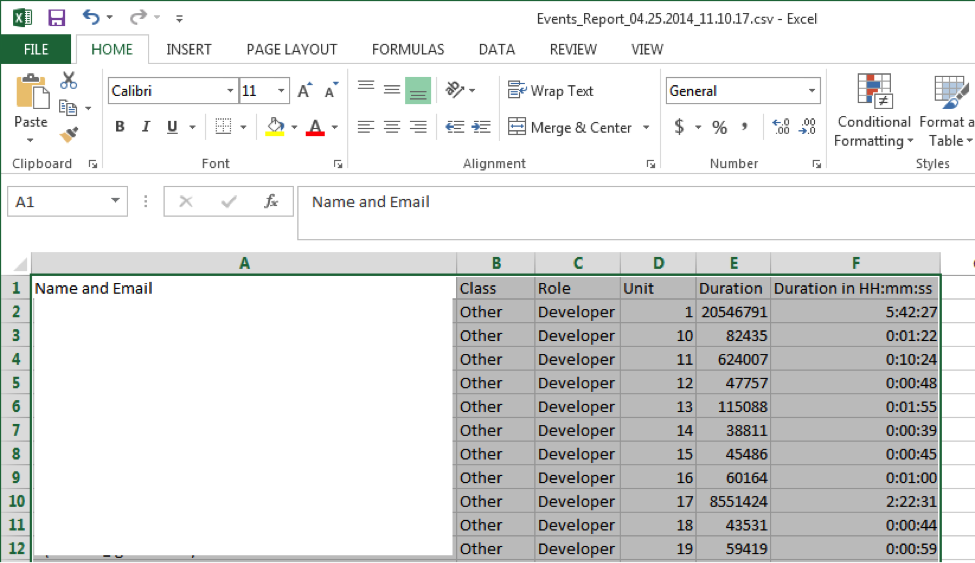
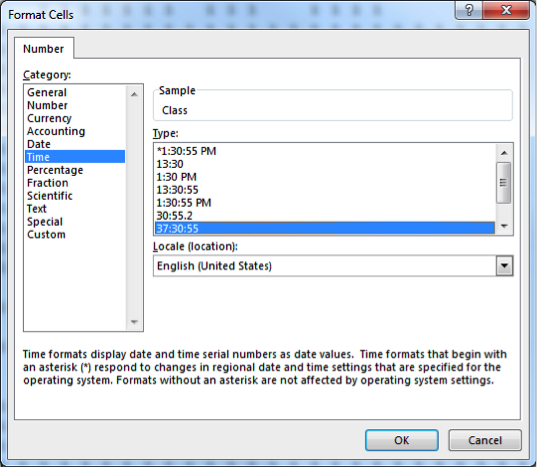
iv. Select the entire column F, right click and select Format Cells
v. Select Time, and the Type as below graph:

vi. Now we are ready to create a pivot table. Select all data in the Excel sheet
vii. On the top navigation bar, click Insert -> PivotChart, Select a table or range with New Worksheet. Click OK
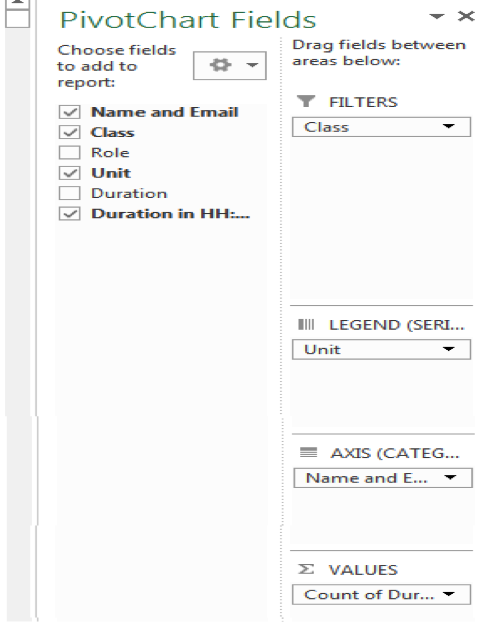
viii. Find the PivotChart Fields on the right column and check Name and Email, Class, Unit and Duration in HH:mm:ss as the graph shown below.
ix. Move the Class to FILTERS, Unit to LEGEND, Name and Email to AXIS, Sum of Duration to VALUES as the graph shown below.
x. Click Count of Duration, select Value Field Settings as below.
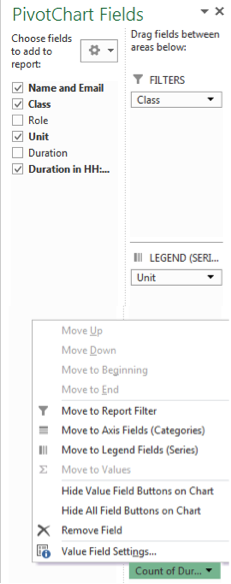
xi. Change the value of “Summarize value field by” to Sum instead of Count.
xii. Click Number Format button at the lower left corner and make the following changes:
xiii. Now you should get a table like the following graph
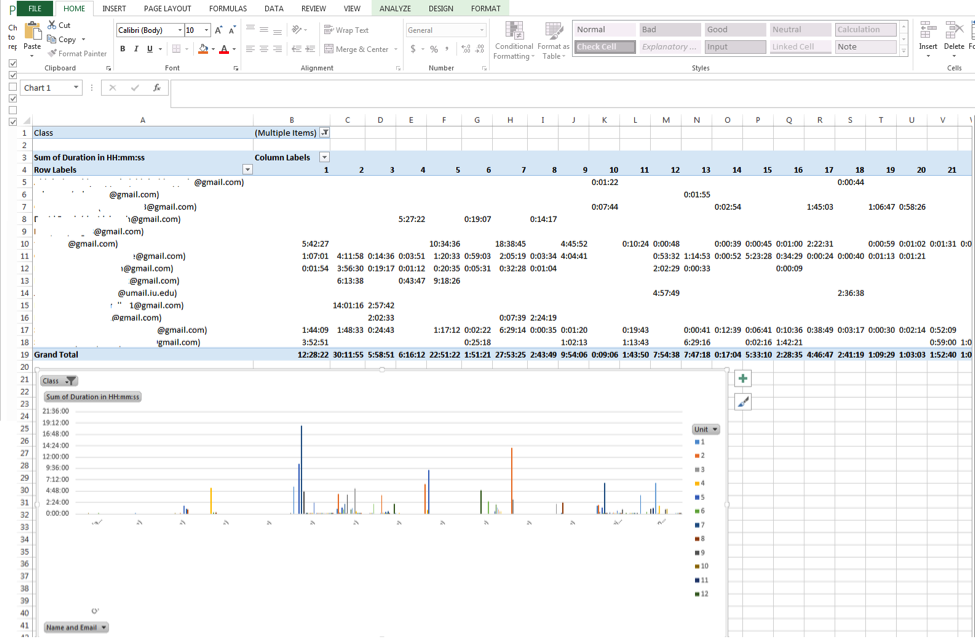
xiv. Make sure you save the file as Excel format.