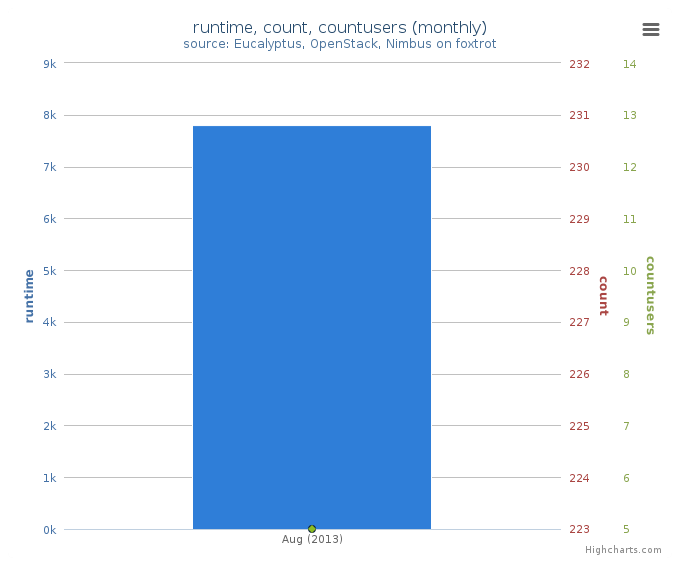
Distribution
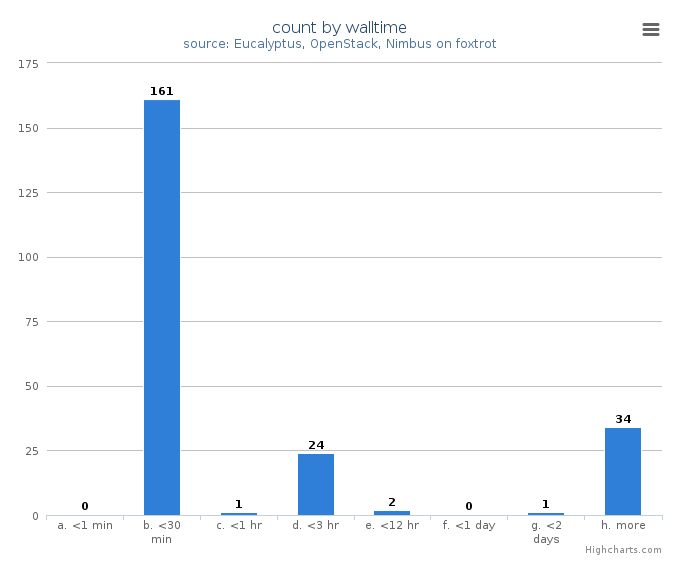
Figure 5: VM count by wall time
This chart illustrates usage patterns of VM instances in terms of running wall time.
- Period: August 01 – August 31, 2013
- Cloud(IaaS): nimbus
- Hostname: foxtrot
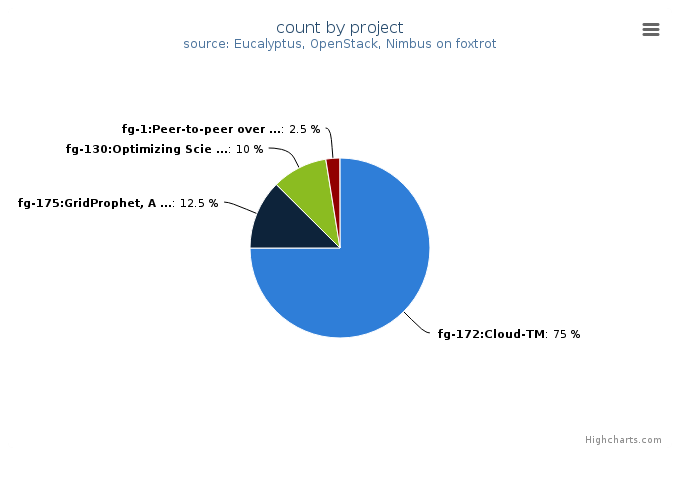
Figure 6: VMs count by project
This chart illustrates the proportion of launched VM instances by project groups. The same data in tabular form follows.
- Period: August 01 – August 31, 2013
- Cloud(IaaS): nimbus
- Hostname: foxtrot
VMs count by project
| Project |
Value |
|---|
| fg-172:Cloud-TM |
30 |
| fg-175:GridProphet, A workflow execution time prediction system for the Grid |
5 |
| fg-130:Optimizing Scientific Workflows on Clouds |
4 |
| fg-1:Peer-to-peer overlay networks and applications in virtual networks and virtual clusters |
1 |
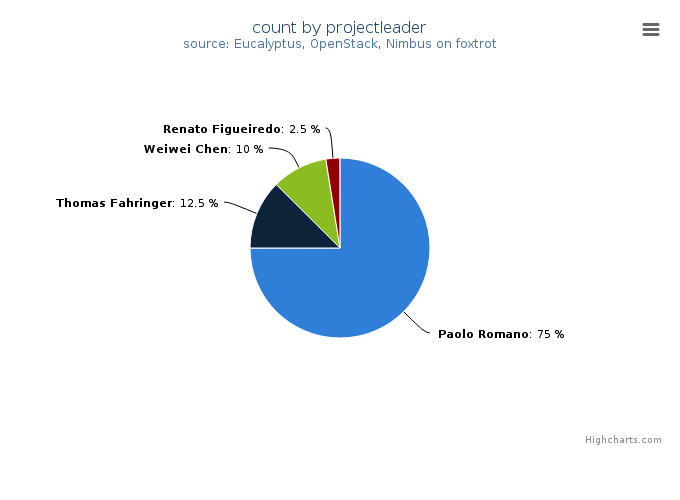
Figure 7: VMs count by project leader
This chart also illustrates the proportion of launched VM instances by project Leader. The same data in tabular form follows.
- Period: August 01 – August 31, 2013
- Cloud(IaaS): nimbus
- Hostname: foxtrot
VMs count by project leader
| Projectleader |
Value |
|---|
| Paolo Romano |
30 |
| Thomas Fahringer |
5 |
| Weiwei Chen |
4 |
| Renato Figueiredo |
1 |
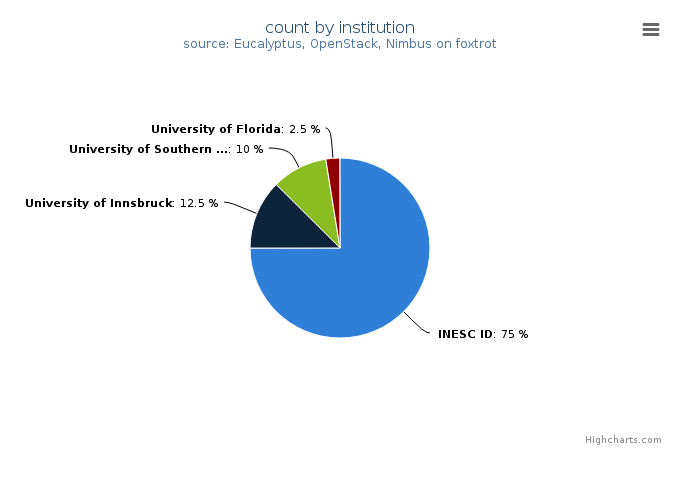
Figure 8: VMs count by institution
This chart illustrates the proportion of launched VM instances by Institution. The same data in tabular form follows.
- Period: August 01 – August 31, 2013
- Cloud(IaaS): nimbus
- Hostname: foxtrot
VMs count by institution
| Institution |
Value |
|---|
| INESC ID |
30 |
| University of Innsbruck |
5 |
| University of Southern California |
4 |
| University of Florida |
1 |
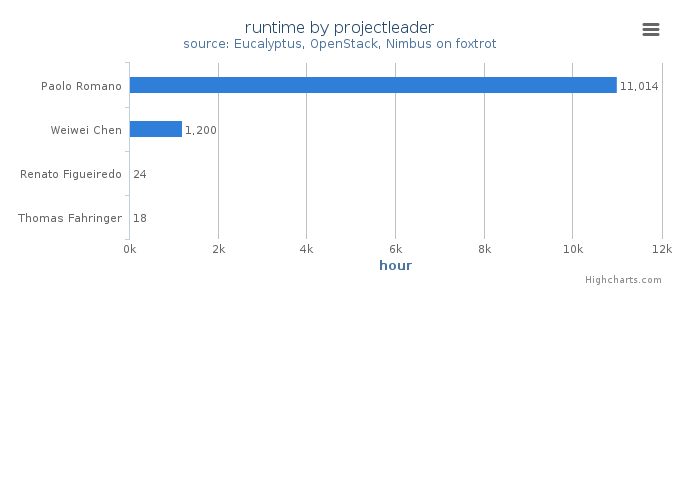
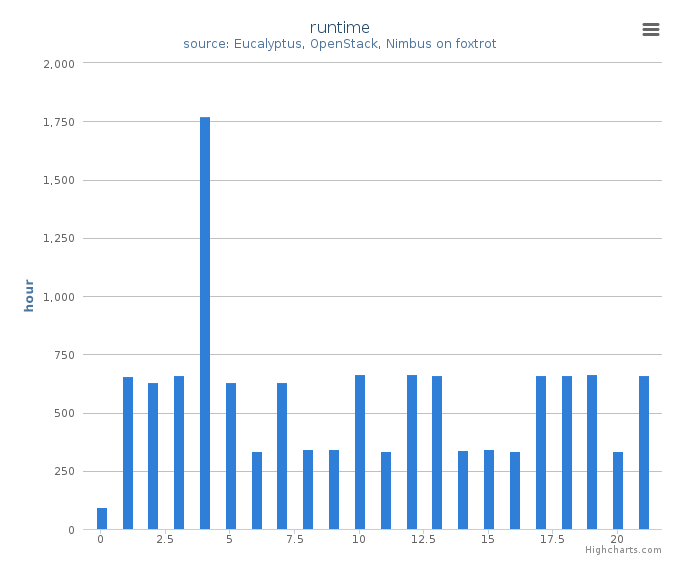
Figure 9: Wall time (hours) by project leader
This chart illustrates proportionate total run times by project leader.
- Period: August 01 – August 31, 2013
- Cloud(IaaS): nimbus
- Hostname: foxtrot