|
|
FutureGrid Cloud Metric |
|
|
FutureGrid Cloud Metric |
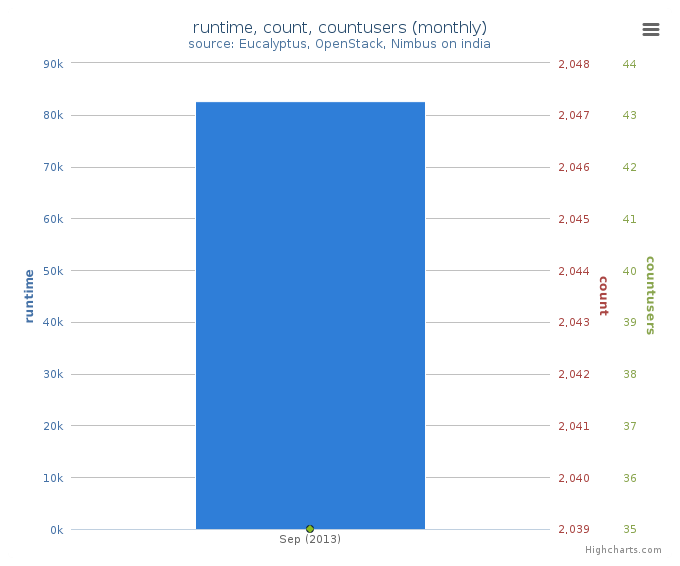
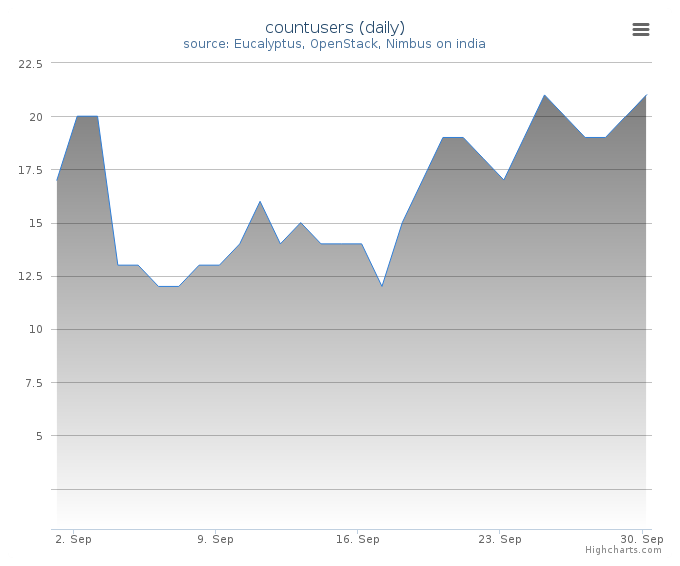
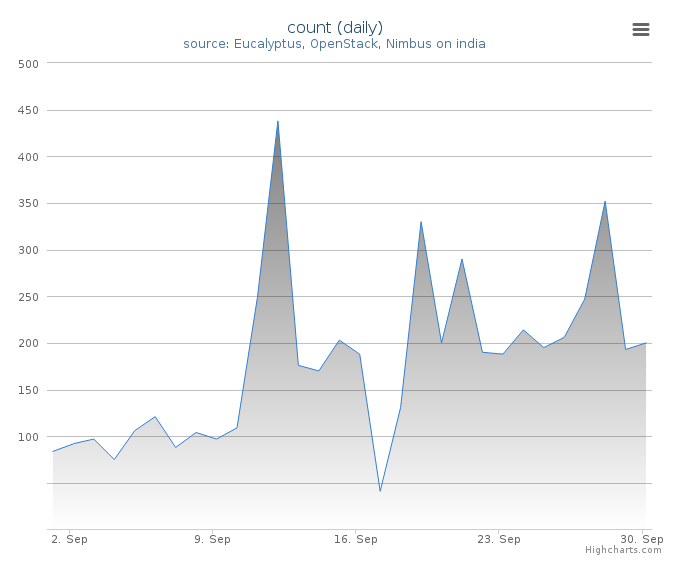
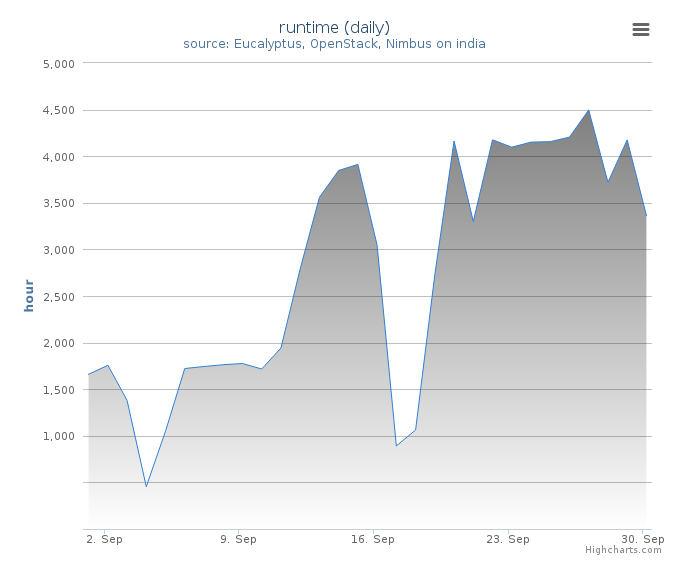
Period: September 01 – September 30, 2013
Cloud(IaaS): openstack, eucalyptus
Hostname: india
| Project | Value |
|---|---|
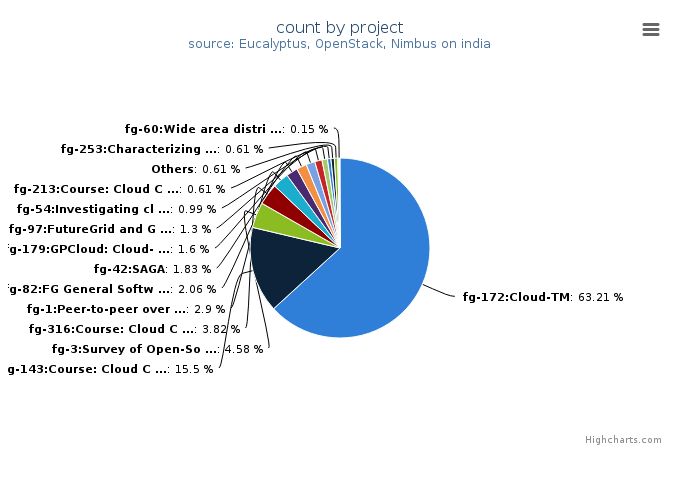
| fg-172:Cloud-TM | 828 |
| fg-143:Course: Cloud Computing for Data Intensive Science Class | 203 |
| fg-3:Survey of Open-Source Cloud Infrastructure using FutureGrid Testbed | 60 |
| fg-316:Course: Cloud Computing Class - third edition | 50 |
| fg-1:Peer-to-peer overlay networks and applications in virtual networks and virtual clusters | 38 |
| fg-82:FG General Software Development | 27 |
| fg-42:SAGA | 24 |
| fg-179:GPCloud: Cloud-based Automatic Repair of Real-World Software Bugs | 21 |
| fg-97:FutureGrid and Grid‘5000 Collaboration | 17 |
| fg-54:Investigating cloud computing as a solution for analyzing particle physics data | 13 |
| fg-213:Course: Cloud Computing class - second edition | 8 |
| Others | 8 |
| fg-253:Characterizing Performance of Infrastructure Clouds | 8 |
| fg-241:Course: Science Cloud Summer School 2012 | 2 |
| fg-60:Wide area distributed file system for MapReduce applications on FutureGrid platform | 2 |
| fg-136:JGC-DataCloud-2012 paper experiments | 1 |
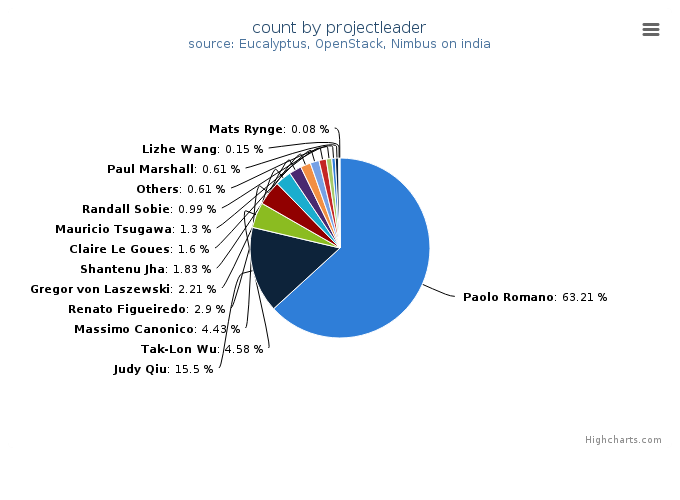
| Projectleader | Value |
|---|---|
| Paolo Romano | 828 |
| Judy Qiu | 203 |
| Tak-Lon Wu | 60 |
| Massimo Canonico | 58 |
| Renato Figueiredo | 38 |
| Gregor von Laszewski | 29 |
| Shantenu Jha | 24 |
| Claire Le Goues | 21 |
| Mauricio Tsugawa | 17 |
| Randall Sobie | 13 |
| Others | 8 |
| Paul Marshall | 8 |
| Lizhe Wang | 2 |
| Mats Rynge | 1 |
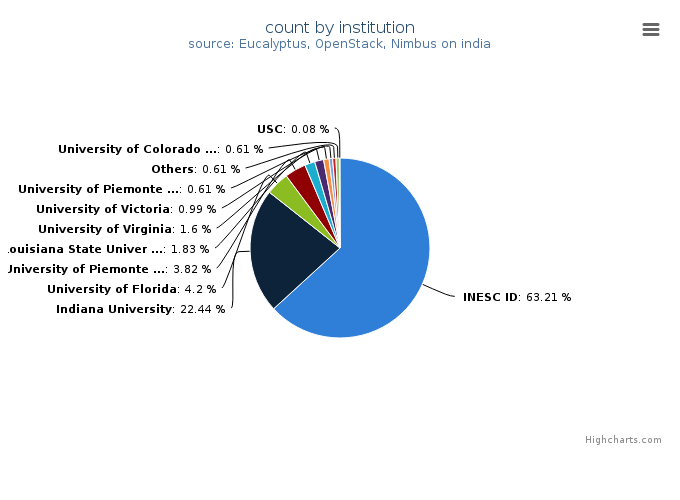
| Institution | Value |
|---|---|
| INESC ID | 828 |
| Indiana University | 294 |
| University of Florida | 55 |
| University of Piemonte Orientale, Computer Science Department | 50 |
| Louisiana State University | 24 |
| University of Virginia | 21 |
| University of Victoria | 13 |
| University of Piemonte Orientale | 8 |
| Others | 8 |
| University of Colorado at Boulder | 8 |
| USC | 1 |
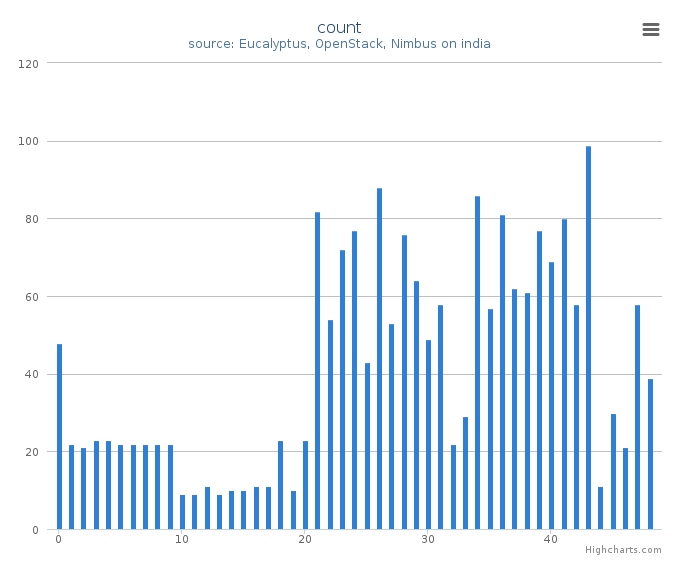
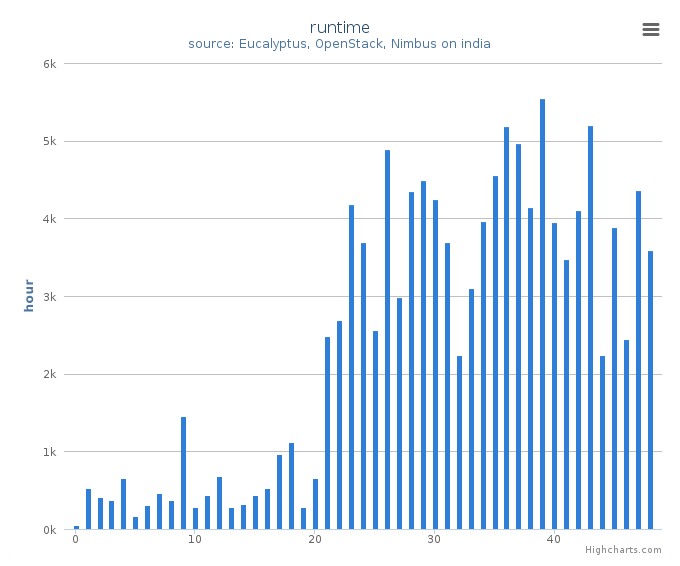
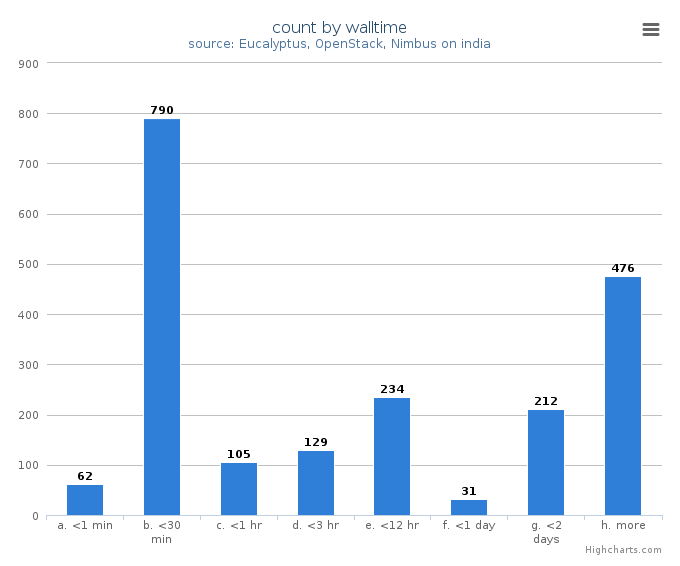
System information shows utilization distribution as to VMs count and wall time. Each cluster represents a compute node.