|
|
FutureGrid Cloud Metric |
|
|
FutureGrid Cloud Metric |
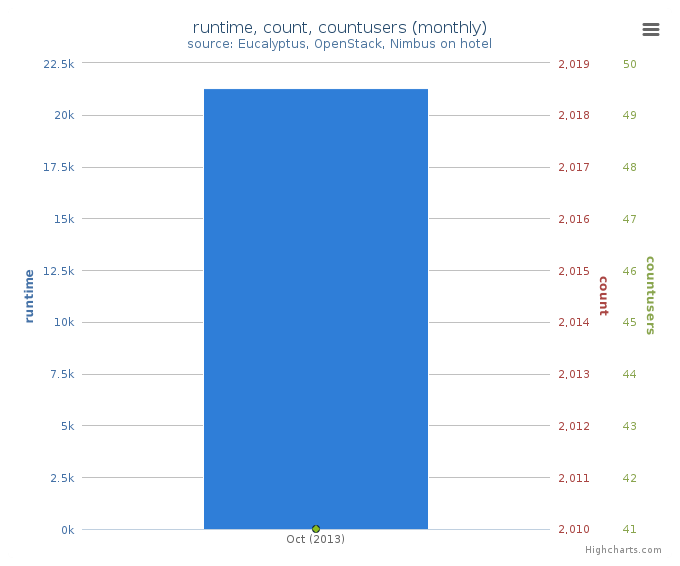
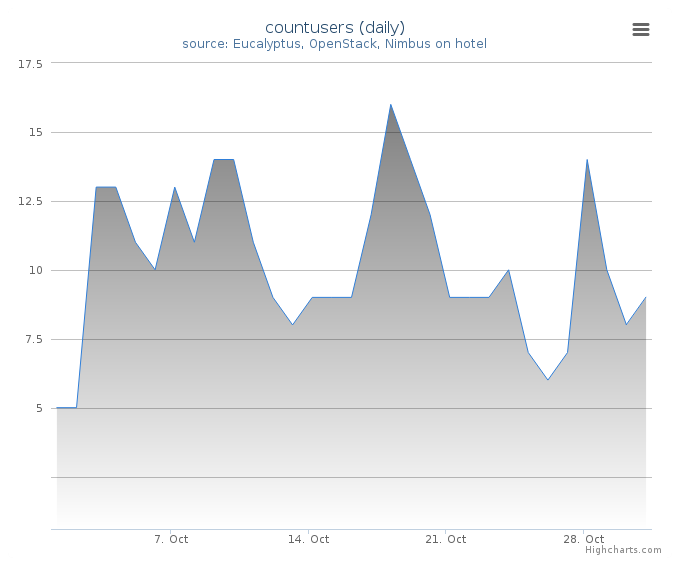
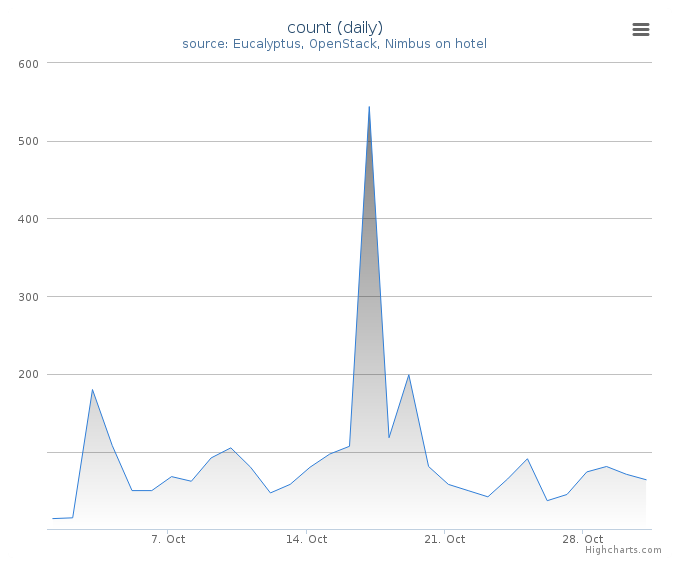
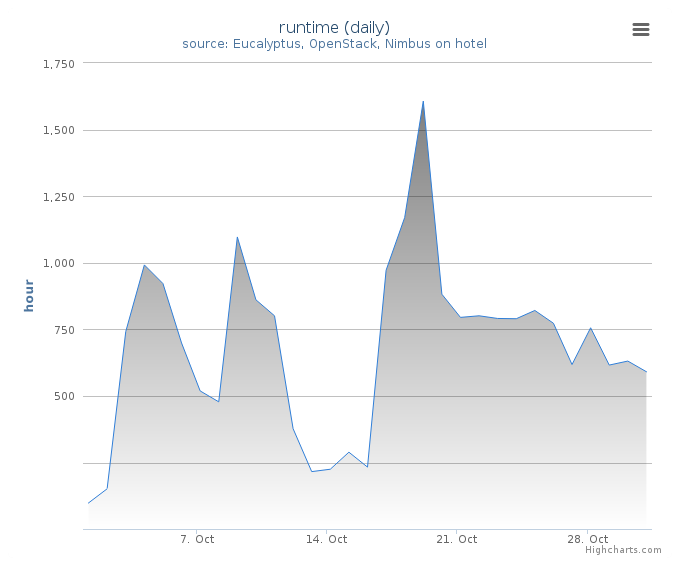
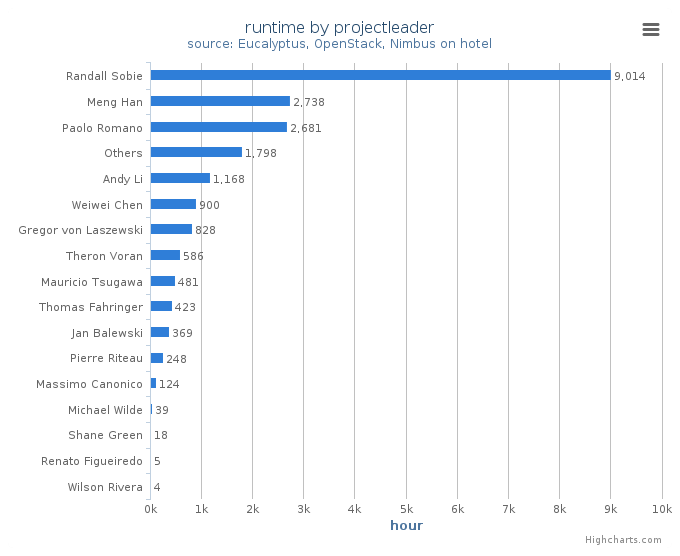
Period: October 01 – October 31, 2013
Cloud(IaaS): nimbus
Hostname: hotel
| Project | Value |
|---|---|
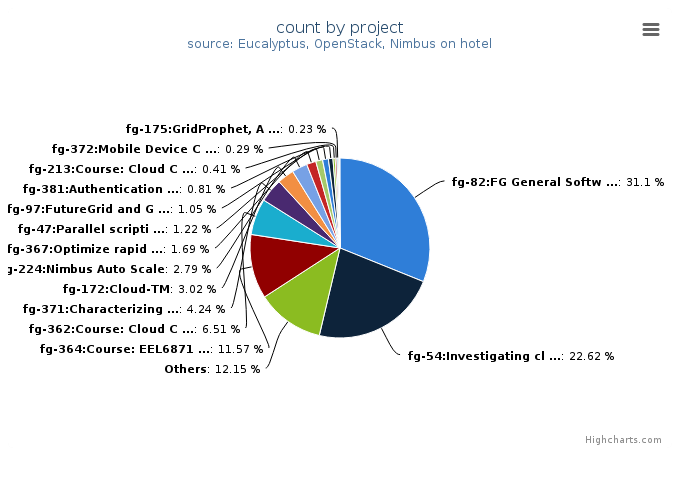
| fg-82:FG General Software Development | 535 |
| fg-54:Investigating cloud computing as a solution for analyzing particle physics data | 389 |
| Others | 209 |
| fg-364:Course: EEL6871 Autonomic Computing | 199 |
| fg-362:Course: Cloud Computing and Storage (UF) | 112 |
| fg-371:Characterizing Infrastructure Cloud Performance for Scientific Computing | 73 |
| fg-172:Cloud-TM | 52 |
| fg-224:Nimbus Auto Scale | 48 |
| fg-367:Optimize rapid deployment and updating of VM images at the remote compute cluster | 29 |
| fg-47:Parallel scripting using cloud resources | 21 |
| fg-97:FutureGrid and Grid‘5000 Collaboration | 18 |
| fg-381:Authentication of Mobile Cloud Computing | 14 |
| fg-213:Course: Cloud Computing class - second edition | 7 |
| fg-372:Mobile Device Computation Offloading over SocialVPNs | 5 |
| fg-175:GridProphet, A workflow execution time prediction system for the Grid | 4 |
| fg-130:Optimizing Scientific Workflows on Clouds | 3 |
| fg-340:Research: Parallel Computing for Machine Learning | 2 |
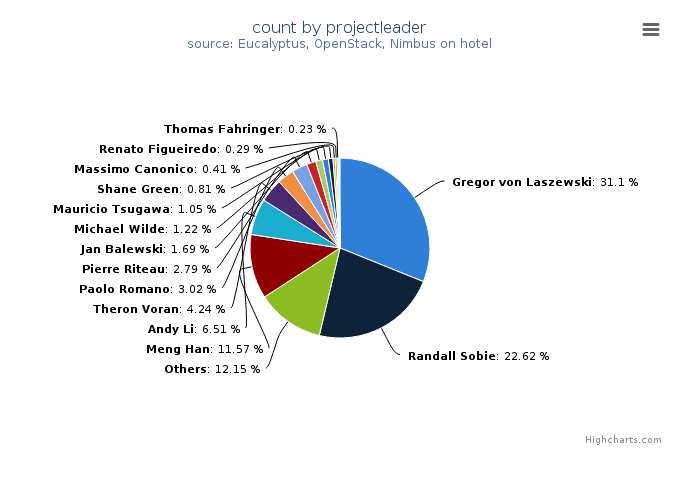
| Projectleader | Value |
|---|---|
| Gregor von Laszewski | 535 |
| Randall Sobie | 389 |
| Others | 209 |
| Meng Han | 199 |
| Andy Li | 112 |
| Theron Voran | 73 |
| Paolo Romano | 52 |
| Pierre Riteau | 48 |
| Jan Balewski | 29 |
| Michael Wilde | 21 |
| Mauricio Tsugawa | 18 |
| Shane Green | 14 |
| Massimo Canonico | 7 |
| Renato Figueiredo | 5 |
| Thomas Fahringer | 4 |
| Weiwei Chen | 3 |
| Wilson Rivera | 2 |
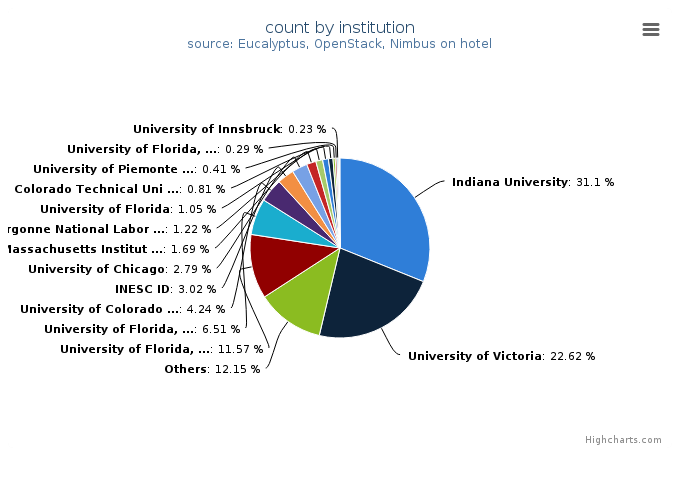
| Institution | Value |
|---|---|
| Indiana University | 535 |
| University of Victoria | 389 |
| Others | 209 |
| University of Florida, ACIS | 199 |
| University of Florida, Department of Electrical and Computer Eng | 112 |
| University of Colorado at Boulder, Computer Science Department | 73 |
| INESC ID | 52 |
| University of Chicago | 48 |
| Massachusetts Institute of Technology, Laboratory for Nuclear Sc | 29 |
| Argonne National Laboratory | 21 |
| University of Florida | 18 |
| Colorado Technical University, Computer Science and Engineering | 14 |
| University of Piemonte Orientale | 7 |
| University of Florida, Electrical and Computer Engineering | 5 |
| University of Innsbruck | 4 |
| University of Southern California | 3 |
| University of Puerto Rico, Electrical and Computer Emgineering D | 2 |
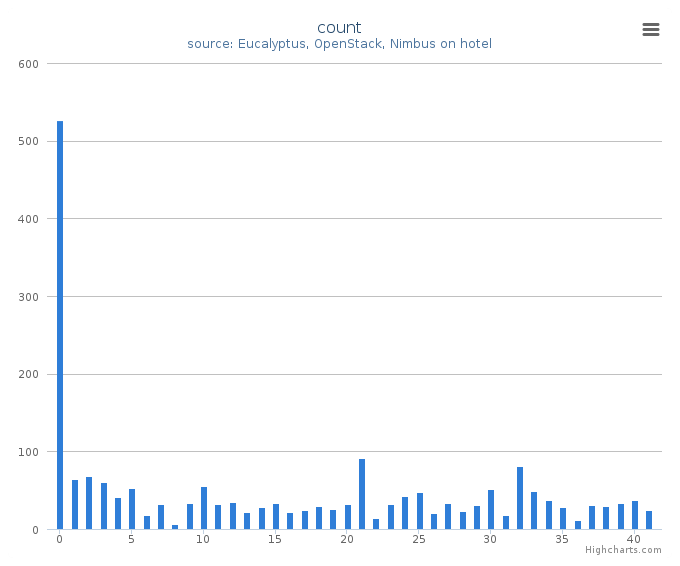
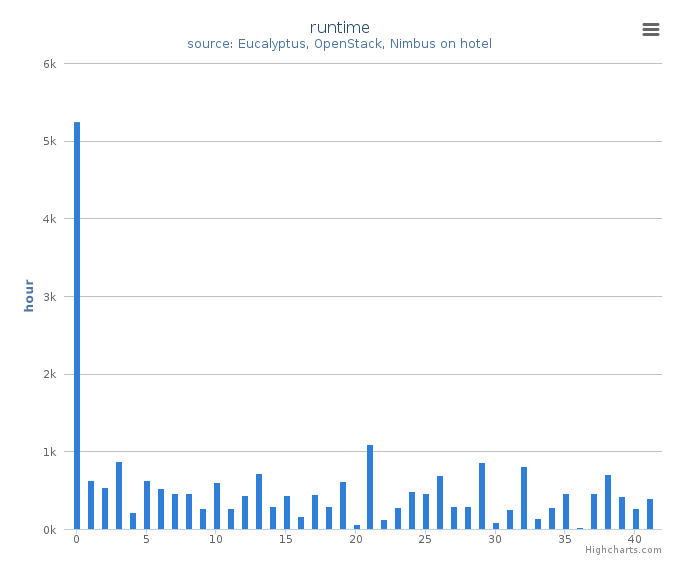
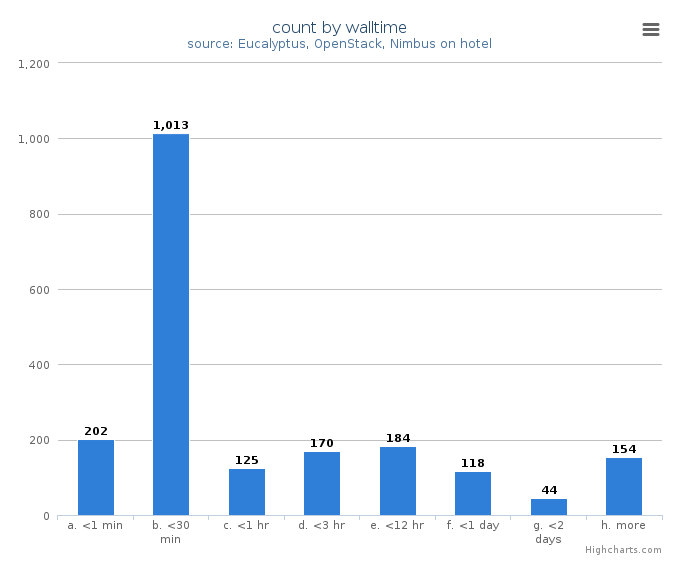
System information shows utilization distribution as to VMs count and wall time. Each cluster represents a compute node.