|
|
FutureGrid Cloud Metric |
|
|
FutureGrid Cloud Metric |
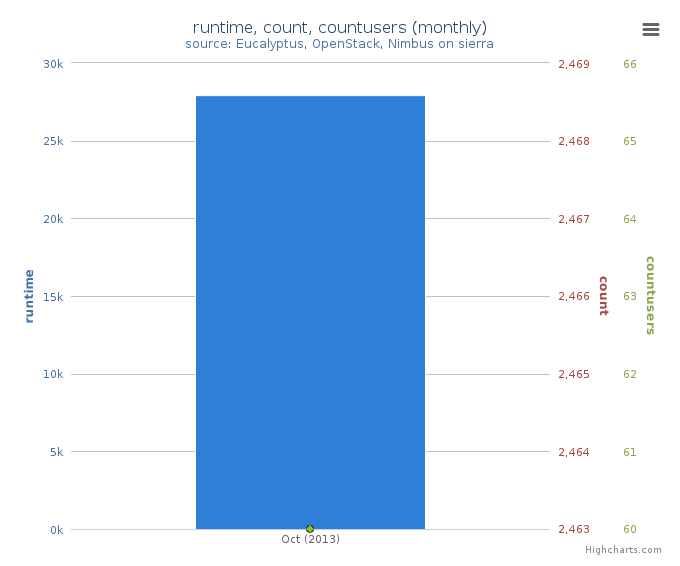
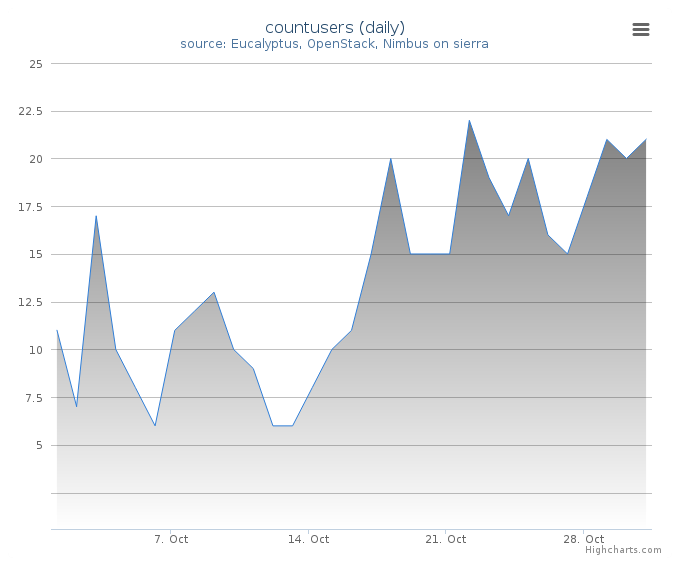
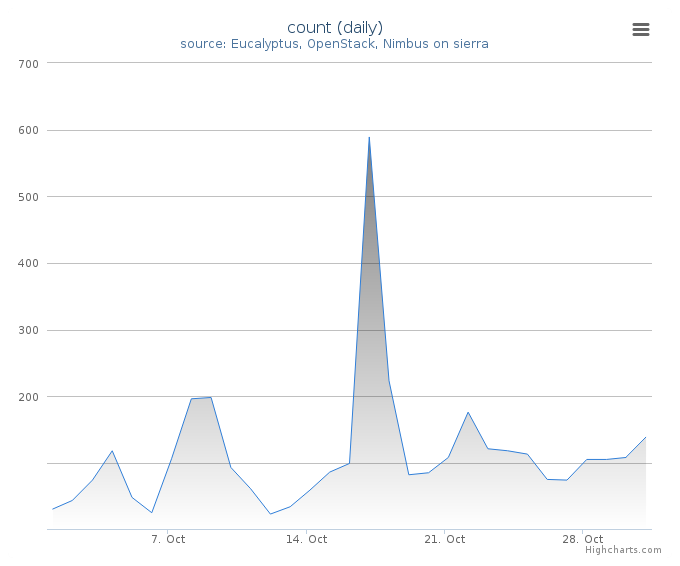
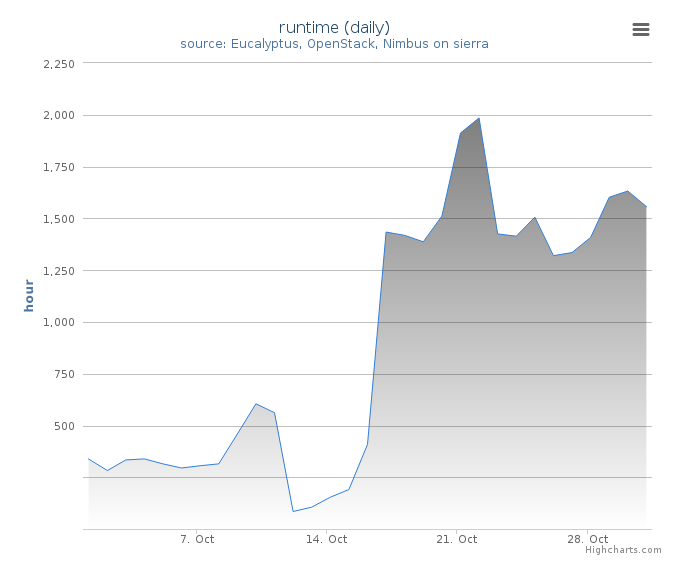
Period: October 01 – October 31, 2013
Cloud(IaaS): nimbus, openstack, eucalyptus
Hostname: sierra
| Project | Value |
|---|---|
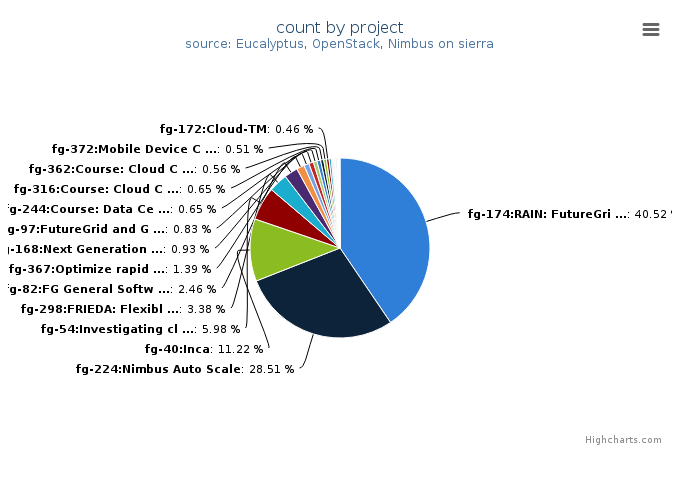
| fg-174:RAIN: FutureGrid Dynamic provisioning Framework | 874 |
| fg-224:Nimbus Auto Scale | 615 |
| fg-40:Inca | 242 |
| fg-54:Investigating cloud computing as a solution for analyzing particle physics data | 129 |
| fg-298:FRIEDA: Flexible Robust Intelligent Elastic Data Management | 73 |
| fg-82:FG General Software Development | 53 |
| fg-367:Optimize rapid deployment and updating of VM images at the remote compute cluster | 30 |
| fg-168:Next Generation Sequencing in the Cloud | 20 |
| fg-97:FutureGrid and Grid‘5000 Collaboration | 18 |
| fg-244:Course: Data Center Scale Computing | 14 |
| fg-316:Course: Cloud Computing Class - third edition | 14 |
| fg-362:Course: Cloud Computing and Storage (UF) | 12 |
| fg-372:Mobile Device Computation Offloading over SocialVPNs | 11 |
| fg-172:Cloud-TM | 10 |
| fg-264:Course: 1st Workshop on bioKepler Tools and Its Applications | 9 |
| fg-215:FuturGrid Directory Entry | 4 |
| fg-389:Investigating the Apache Big Data Stack | 4 |
| fg-334:Tutorial on Cloud Computing and Software-defined Networking | 3 |
| fg-381:Authentication of Mobile Cloud Computing | 3 |
| fg-380:FutureGrid Support for BigData MOOC | 3 |
| fg-1:Peer-to-peer overlay networks and applications in virtual networks and virtual clusters | 3 |
| fg-364:Course: EEL6871 Autonomic Computing | 3 |
| fg-10:TeraGrid XD TIS(Technology Insertion Service) Technology Evaluation Laboratory | 2 |
| fg-363:Course: Applied Cyberinfrastructure concepts | 2 |
| fg-301:Course: Advanced Networking class University of Colorado | 1 |
| fg-314:User-friendly tools to play with cloud platforms | 1 |
| fg-315:Biome representational in silico karyotyping | 1 |
| fg-243:Applied Cyberinfrastructure concepts | 1 |
| fg-355:Course: Data Center Scale Computing Class | 1 |
| fg-69:Investigate provenance collection for MapReduce | 1 |
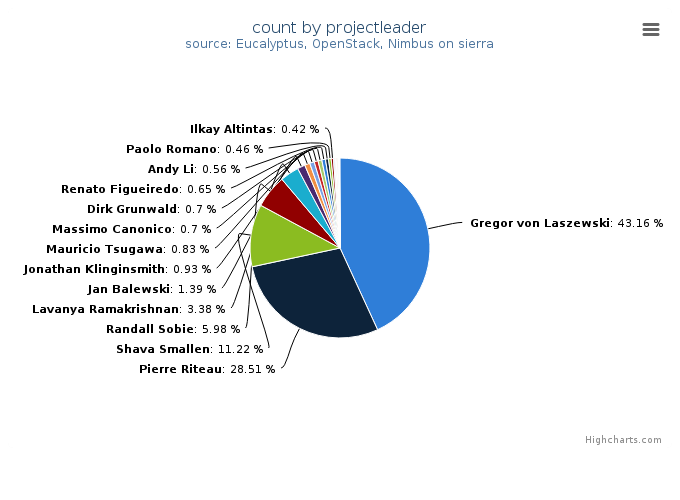
| Projectleader | Value |
|---|---|
| Gregor von Laszewski | 931 |
| Pierre Riteau | 615 |
| Shava Smallen | 242 |
| Randall Sobie | 129 |
| Lavanya Ramakrishnan | 73 |
| Jan Balewski | 30 |
| Jonathan Klinginsmith | 20 |
| Mauricio Tsugawa | 18 |
| Massimo Canonico | 15 |
| Dirk Grunwald | 15 |
| Renato Figueiredo | 14 |
| Andy Li | 12 |
| Paolo Romano | 10 |
| Ilkay Altintas | 9 |
| ibrahim hallac | 4 |
| Nirav Merchant | 3 |
| Shane Green | 3 |
| Meng Han | 3 |
| Jose Fortes | 3 |
| Abhilash Koppula | 3 |
| John Lockman | 2 |
| Aaron Lee | 1 |
| Jiaan Zeng | 1 |
| Eric Keller | 1 |
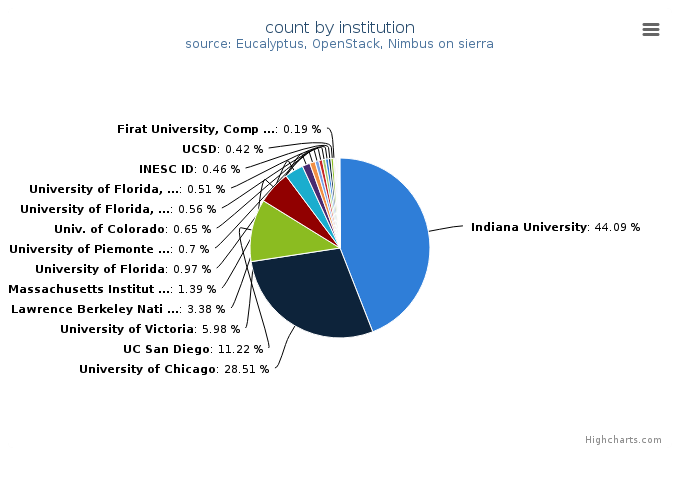
| Institution | Value |
|---|---|
| Indiana University | 951 |
| University of Chicago | 615 |
| UC San Diego | 242 |
| University of Victoria | 129 |
| Lawrence Berkeley National Lab | 73 |
| Massachusetts Institute of Technology, Laboratory for Nuclear Sc | 30 |
| University of Florida | 21 |
| University of Piemonte Orientale, Computer Science Department | 15 |
| Univ. of Colorado | 14 |
| University of Florida, Department of Electrical and Computer Eng | 12 |
| University of Florida, Electrical and Computer Engineering | 11 |
| INESC ID | 10 |
| UCSD | 9 |
| Firat University, Computer Science Department | 4 |
| University of Florida, Advanced Computing and Information System | 3 |
| University of Florida, ACIS | 3 |
| Colorado Technical University, Computer Science and Engineering | 3 |
| Indiana University, Community Grids Lab | 3 |
| University of Texas at Austin | 2 |
| University of Arizona, Arizona Research Laboratories, School of | 2 |
| Washington University at St Louis, School of Medicine, Departmen | 1 |
| University of Colorado | 1 |
| Computer Science | 1 |
| Univ. of Colorado, Boulder, Computer Science | 1 |
| University of Arizona | 1 |
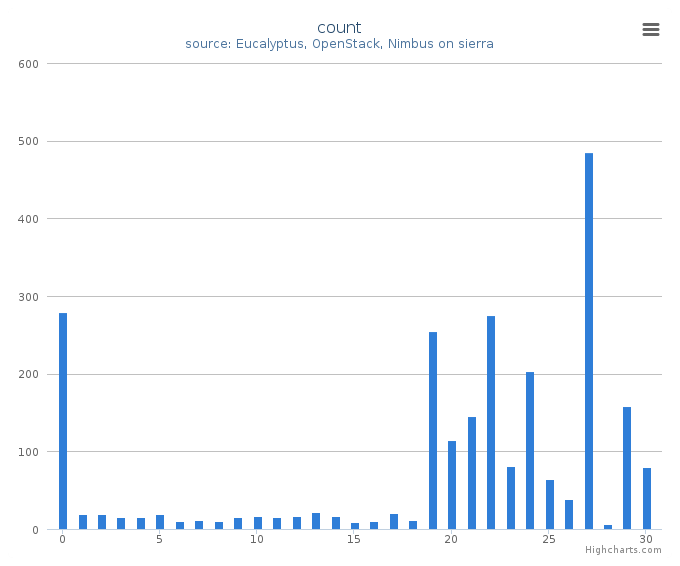
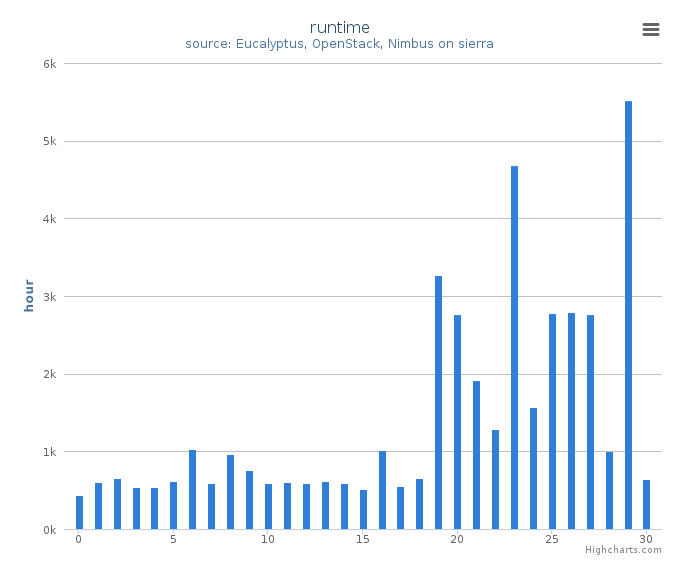
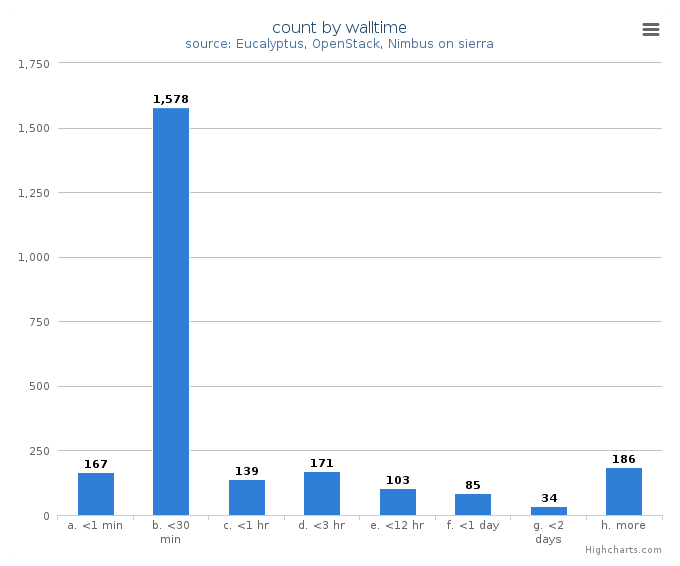
System information shows utilization distribution as to VMs count and wall time. Each cluster represents a compute node.