|
|
FutureGrid Cloud Metric |
|
|
FutureGrid Cloud Metric |
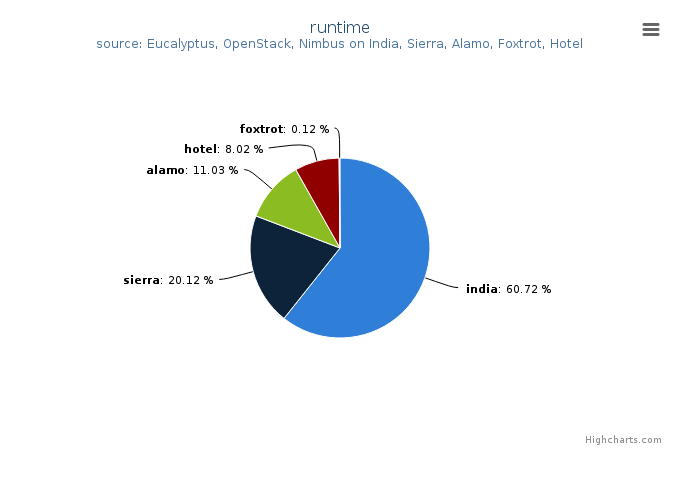
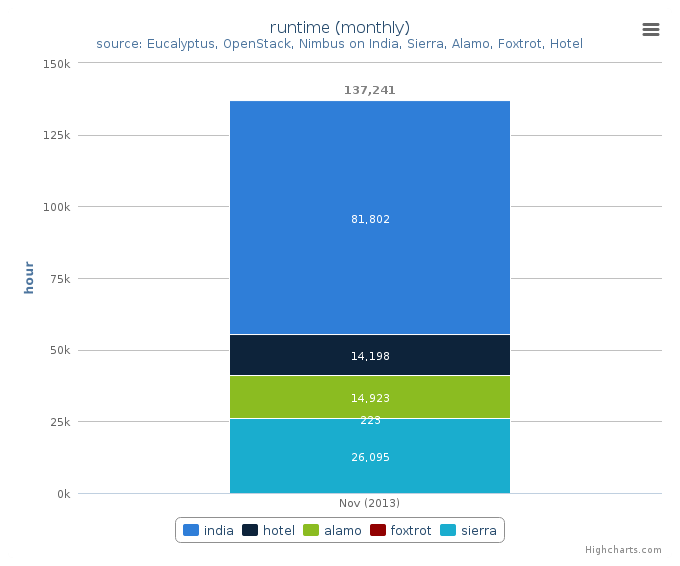
Period: November 01 – November 30, 2013
| Total | Value |
|---|---|
| india | 115591.0 |
| sierra | 38297.0 |
| alamo | 20995.0 |
| hotel | 15259.0 |
| foxtrot | 223.0 |
Period: November 01 – November 30, 2013
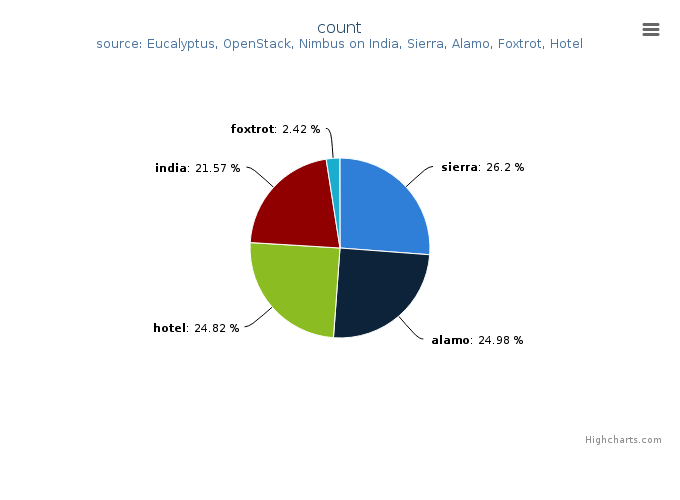
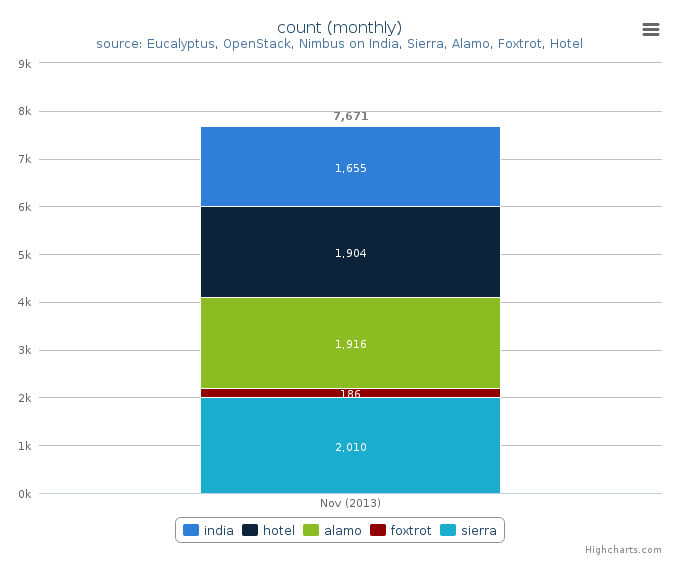
Period: November 01 – November 30, 2013
| Total | Value |
|---|---|
| sierra | 2010 |
| alamo | 1916 |
| hotel | 1904 |
| india | 1655 |
| foxtrot | 186 |
Period: November 01 – November 30, 2013
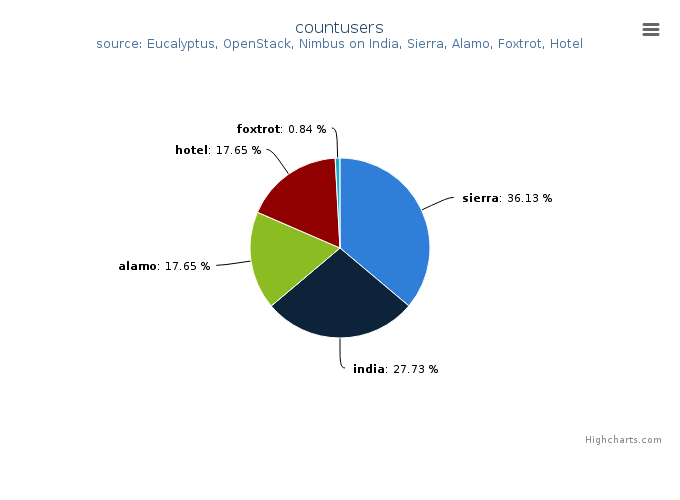
Period: November 01 – November 30, 2013
| Total | Value |
|---|---|
| sierra | 43 |
| india | 33 |
| hotel | 21 |
| alamo | 21 |
| foxtrot | 1 |
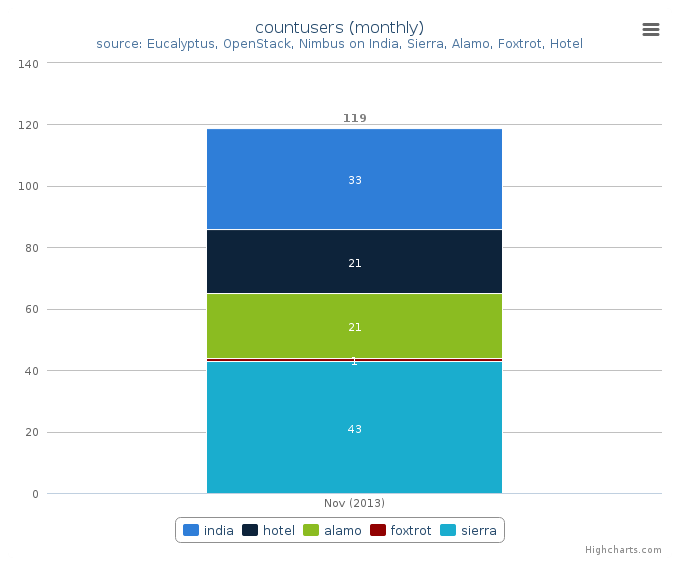
Period: November 01 – November 30, 2013