|
|
FutureGrid Cloud Metric |
|
|
FutureGrid Cloud Metric |
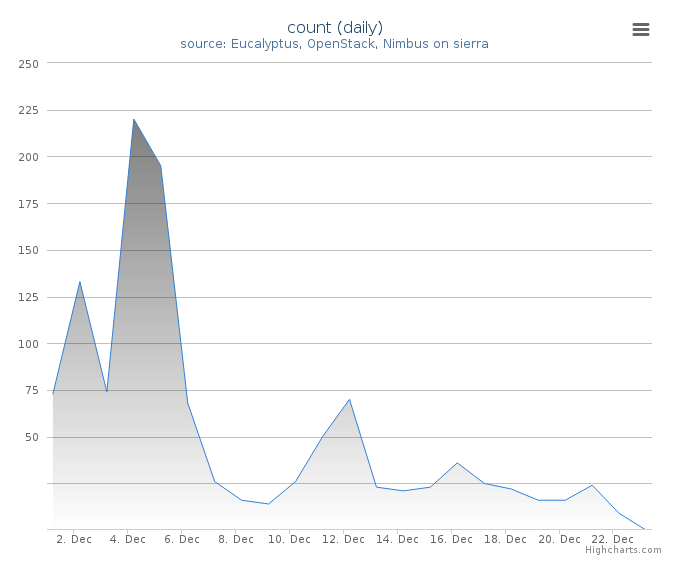
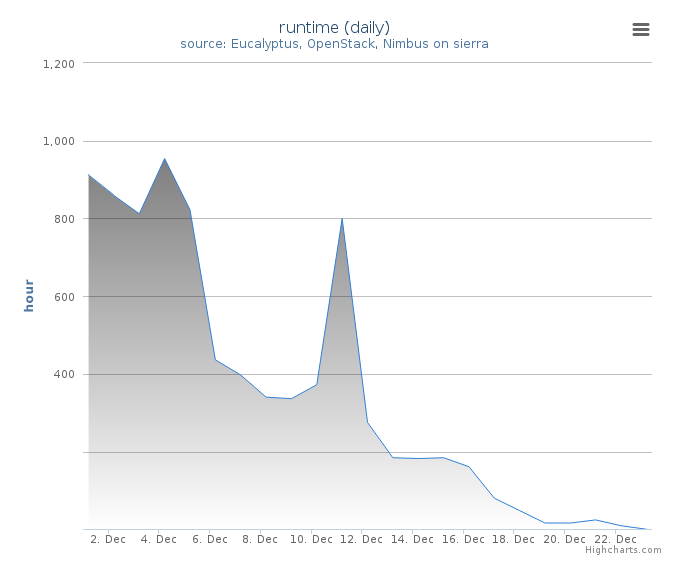
Period: December 01 – December 23, 2013
Cloud(IaaS): nimbus, openstack, eucalyptus
Hostname: sierra
| Project | Value |
|---|---|
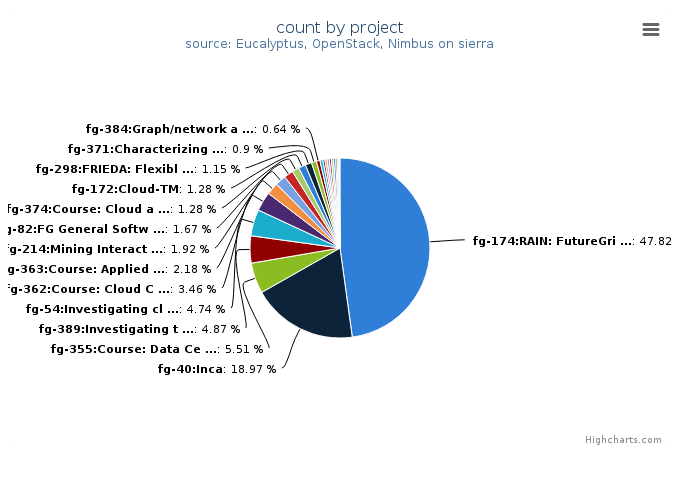
| fg-174:RAIN: FutureGrid Dynamic provisioning Framework | 373 |
| fg-40:Inca | 148 |
| fg-355:Course: Data Center Scale Computing Class | 43 |
| fg-389:Investigating the Apache Big Data Stack | 38 |
| fg-54:Investigating cloud computing as a solution for analyzing particle physics data | 37 |
| fg-362:Course: Cloud Computing and Storage (UF) | 27 |
| fg-363:Course: Applied Cyberinfrastructure concepts | 17 |
| fg-214:Mining Interactions between Network Community Structure and Information Diffusion | 15 |
| fg-82:FG General Software Development | 13 |
| fg-374:Course: Cloud and Distributed Computing | 10 |
| fg-172:Cloud-TM | 10 |
| fg-298:FRIEDA: Flexible Robust Intelligent Elastic Data Management | 9 |
| fg-371:Characterizing Infrastructure Cloud Performance for Scientific Computing | 7 |
| fg-384:Graph/network analysis Resource manager | 5 |
| fg-175:GridProphet, A workflow execution time prediction system for the Grid | 4 |
| fg-367:Optimize rapid deployment and updating of VM images at the remote compute cluster | 3 |
| fg-1:Peer-to-peer overlay networks and applications in virtual networks and virtual clusters | 3 |
| fg-382:Reliability Analysis using Hadoop and MapReduce | 3 |
| fg-97:FutureGrid and Grid‘5000 Collaboration | 3 |
| fg-10:TeraGrid XD TIS(Technology Insertion Service) Technology Evaluation Laboratory | 3 |
| fg-372:Mobile Device Computation Offloading over SocialVPNs | 3 |
| fg-168:Next Generation Sequencing in the Cloud | 2 |
| fg-264:Course: 1st Workshop on bioKepler Tools and Its Applications | 2 |
| fg-233:CINET - A Cyber-Infrastructure for Network Science | 1 |
| fg-340:Research: Parallel Computing for Machine Learning | 1 |
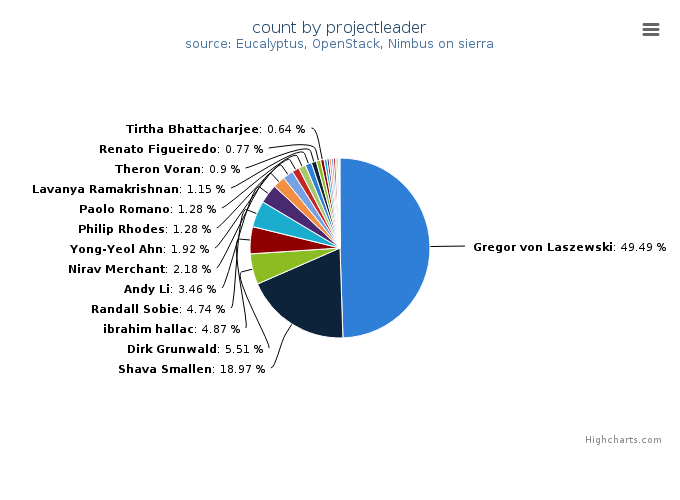
| Projectleader | Value |
|---|---|
| Gregor von Laszewski | 386 |
| Shava Smallen | 148 |
| Dirk Grunwald | 43 |
| ibrahim hallac | 38 |
| Randall Sobie | 37 |
| Andy Li | 27 |
| Nirav Merchant | 17 |
| Yong-Yeol Ahn | 15 |
| Philip Rhodes | 10 |
| Paolo Romano | 10 |
| Lavanya Ramakrishnan | 9 |
| Theron Voran | 7 |
| Renato Figueiredo | 6 |
| Tirtha Bhattacharjee | 5 |
| Thomas Fahringer | 4 |
| John Lockman | 3 |
| Jan Balewski | 3 |
| Carl Walasek | 3 |
| Mauricio Tsugawa | 3 |
| Ilkay Altintas | 2 |
| Jonathan Klinginsmith | 2 |
| Keith Bisset | 1 |
| Wilson Rivera | 1 |
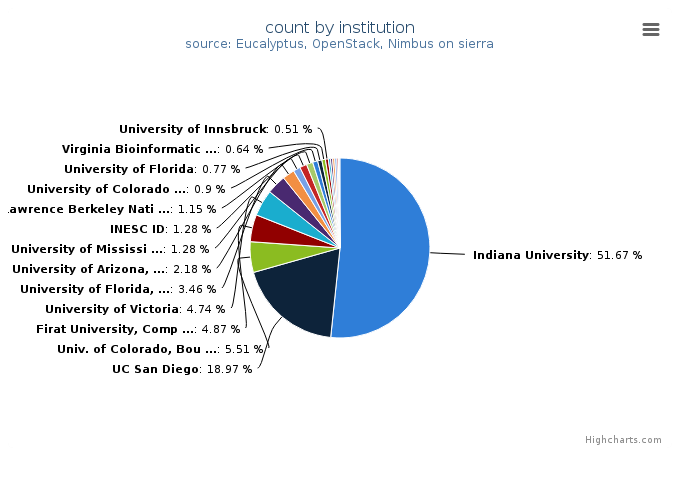
| Institution | Value |
|---|---|
| Indiana University | 403 |
| UC San Diego | 148 |
| Univ. of Colorado, Boulder, Computer Science | 43 |
| Firat University, Computer Science Department | 38 |
| University of Victoria | 37 |
| University of Florida, Department of Electrical and Computer Eng | 27 |
| University of Arizona, Arizona Research Laboratories, School of | 17 |
| University of Mississippi, Department of Computer Science | 10 |
| INESC ID | 10 |
| Lawrence Berkeley National Lab | 9 |
| University of Colorado at Boulder, Computer Science Department | 7 |
| University of Florida | 6 |
| Virginia Bioinformatics Institute, Virginia Polytechnic Institut | 5 |
| University of Innsbruck | 4 |
| University of Texas at Austin | 3 |
| University of Florida, Electrical and Computer Engineering | 3 |
| Massachusetts Institute of Technology, Laboratory for Nuclear Sc | 3 |
| University of the Sciences , Mathematics, Physics, and Statistic | 3 |
| UCSD | 2 |
| University of Puerto Rico, Electrical and Computer Emgineering D | 1 |
| Virginia Tech | 1 |
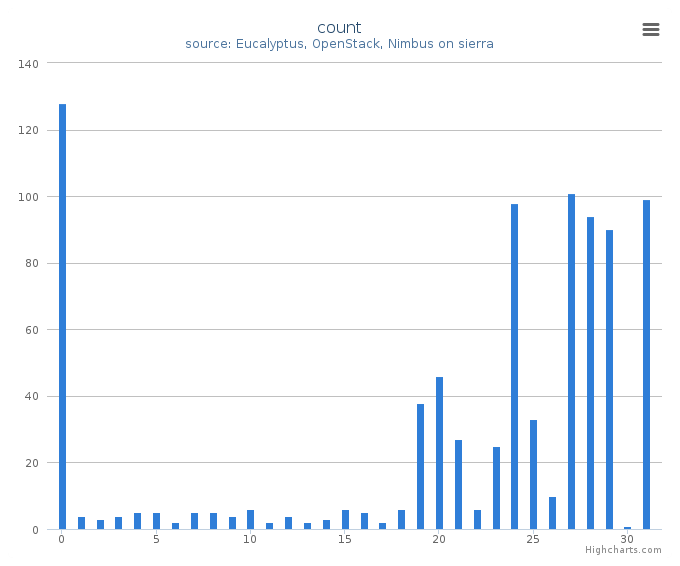
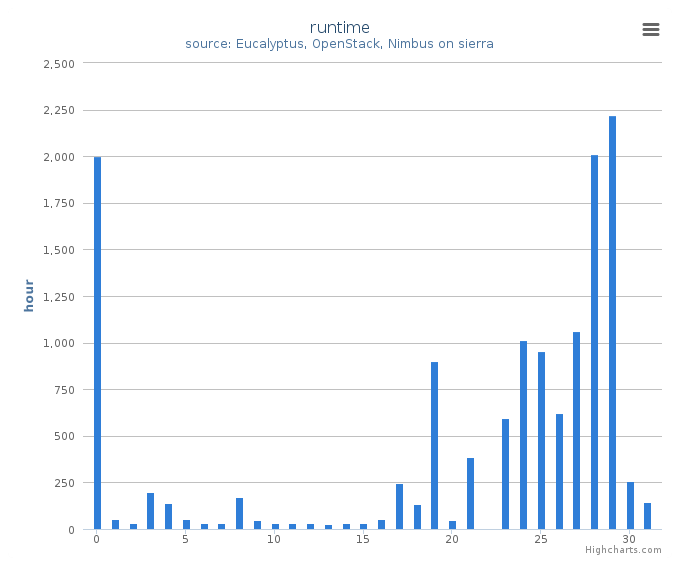
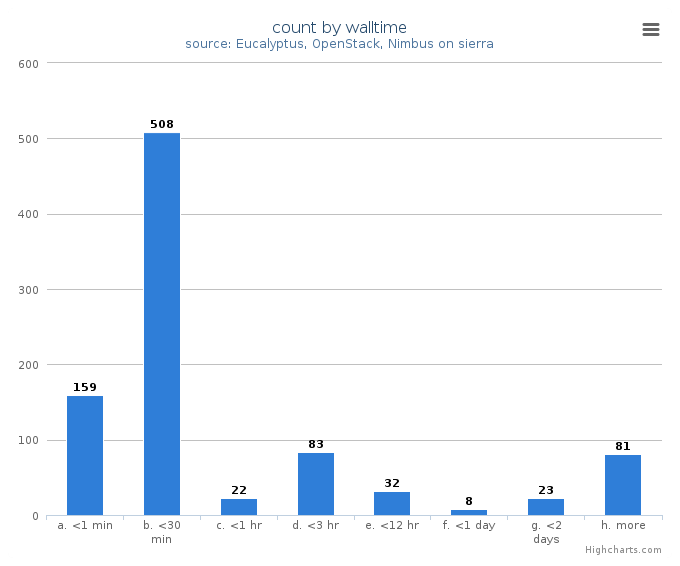
System information shows utilization distribution as to VMs count and wall time. Each cluster represents a compute node.