|
|
FutureGrid Cloud Metric |
|
|
FutureGrid Cloud Metric |
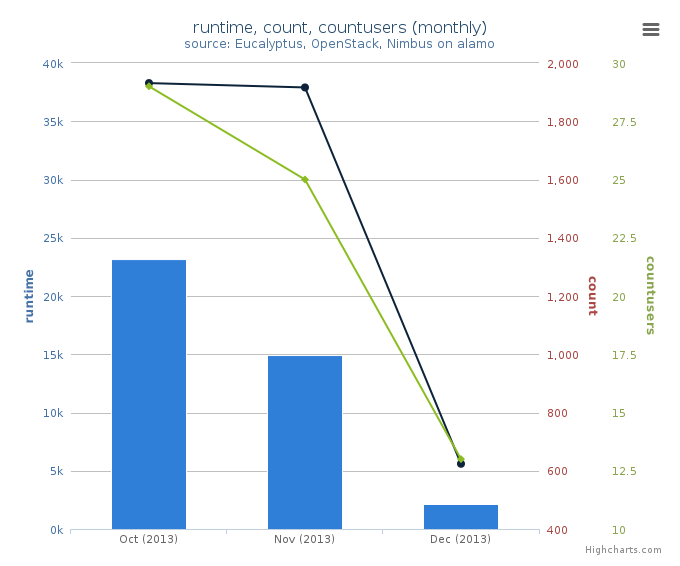
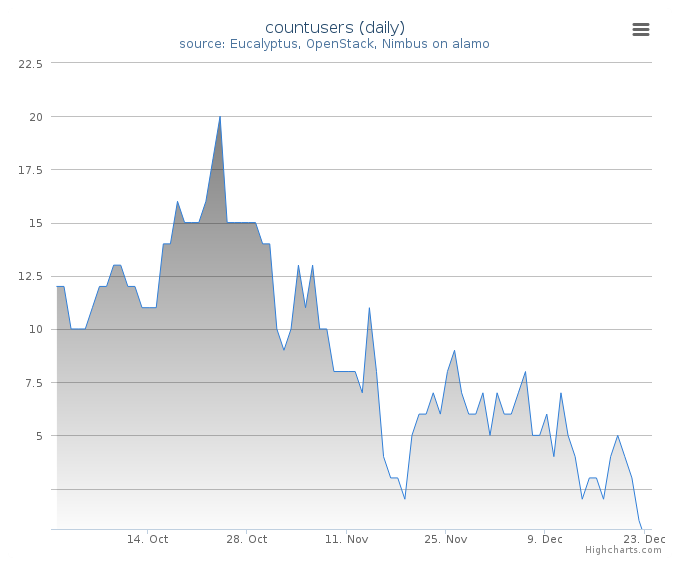
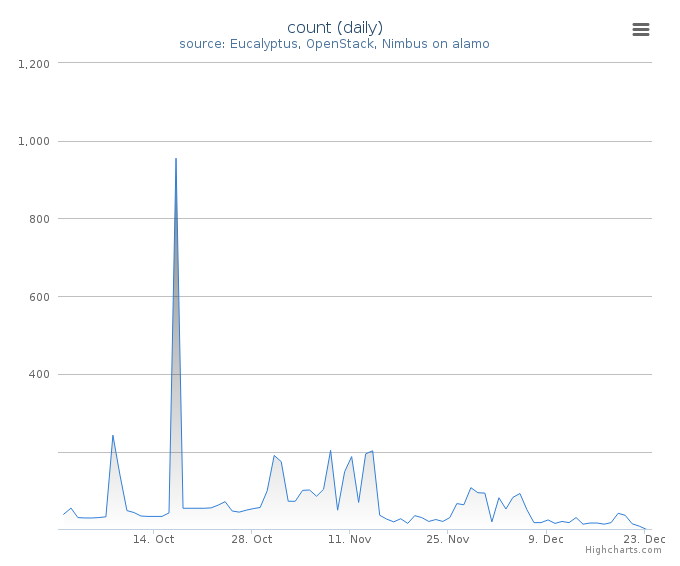
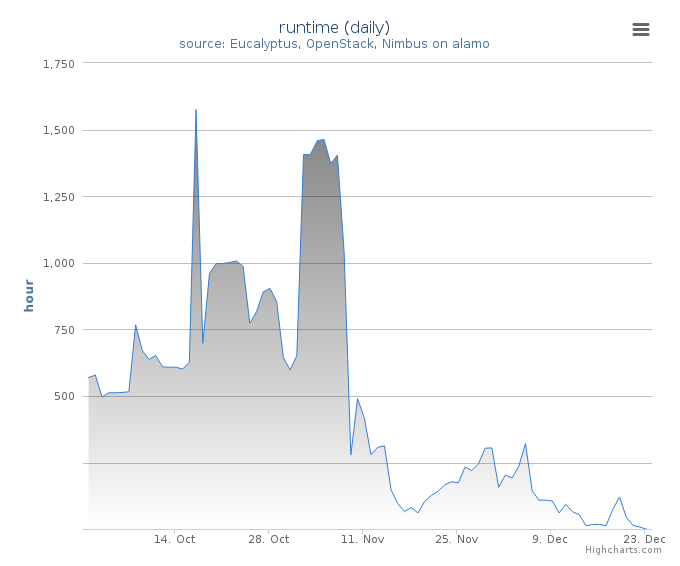
Period: October 01 – December 23, 2013
Cloud(IaaS): nimbus, openstack
Hostname: alamo
| Project | Value |
|---|---|
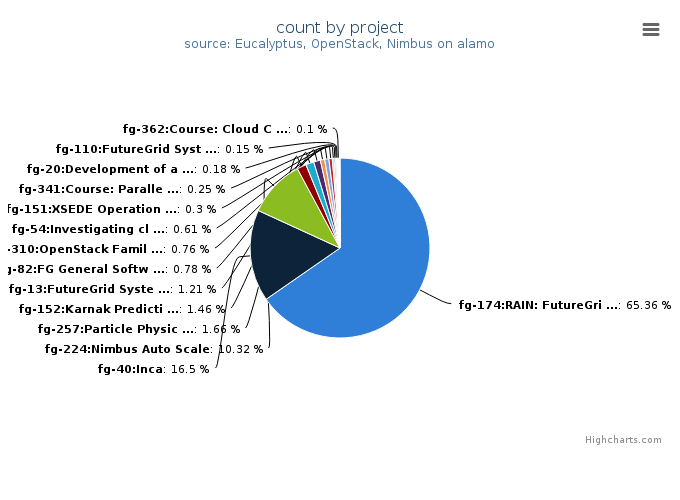
| fg-174:RAIN: FutureGrid Dynamic provisioning Framework | 2591 |
| fg-40:Inca | 654 |
| fg-224:Nimbus Auto Scale | 409 |
| fg-257:Particle Physics Data analysis cluster for ATLAS LHC experiment | 66 |
| fg-152:Karnak Prediction Service | 58 |
| fg-13:FutureGrid Systems Development and Prototyping | 48 |
| fg-82:FG General Software Development | 31 |
| fg-310:OpenStack Familiarization for TACC | 30 |
| fg-54:Investigating cloud computing as a solution for analyzing particle physics data | 24 |
| fg-151:XSEDE Operations Group | 12 |
| fg-341:Course: Parallel Computing | 10 |
| fg-20:Development of an information service for FutureGrid | 7 |
| fg-110:FutureGrid Systems Development | 6 |
| fg-97:FutureGrid and Grid‘5000 Collaboration | 4 |
| fg-362:Course: Cloud Computing and Storage (UF) | 4 |
| fg-248:Geophysical fluid dynamics education and research | 3 |
| fg-312:Sensor-Rocks: A novel integrated framework to improve software Operations and Management (O&M) and power management in environmental observing systems | 3 |
| fg-175:GridProphet, A workflow execution time prediction system for the Grid | 2 |
| fg-172:Cloud-TM | 1 |
| fg-136:JGC-DataCloud-2012 paper experiments | 1 |
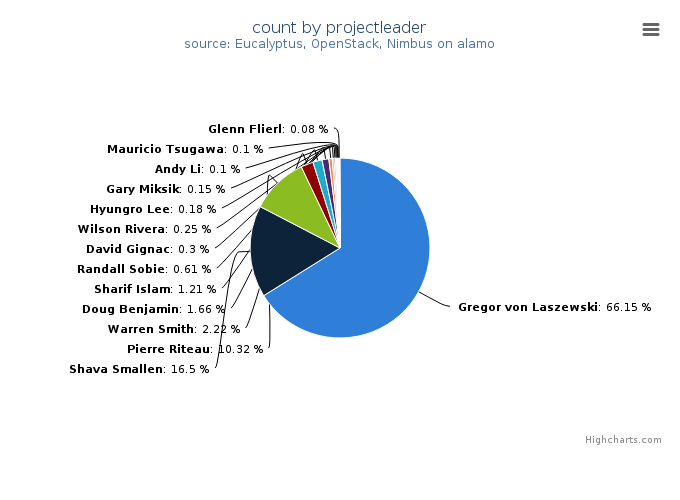
| Projectleader | Value |
|---|---|
| Gregor von Laszewski | 2622 |
| Shava Smallen | 654 |
| Pierre Riteau | 409 |
| Warren Smith | 88 |
| Doug Benjamin | 66 |
| Sharif Islam | 48 |
| Randall Sobie | 24 |
| David Gignac | 12 |
| Wilson Rivera | 10 |
| Hyungro Lee | 7 |
| Gary Miksik | 6 |
| Andy Li | 4 |
| Mauricio Tsugawa | 4 |
| Sameer Tilak | 3 |
| Glenn Flierl | 3 |
| Thomas Fahringer | 2 |
| Mats Rynge | 1 |
| Paolo Romano | 1 |
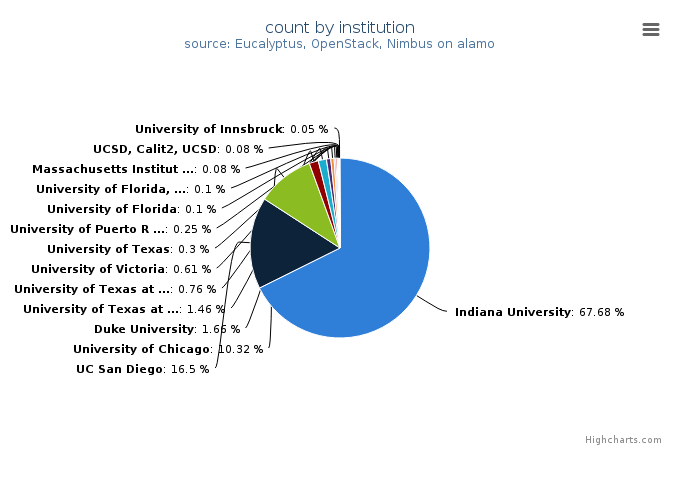
| Institution | Value |
|---|---|
| Indiana University | 2683 |
| UC San Diego | 654 |
| University of Chicago | 409 |
| Duke University | 66 |
| University of Texas at Austin | 58 |
| University of Texas at Austin, Texas Advanced Computing Center | 30 |
| University of Victoria | 24 |
| University of Texas | 12 |
| University of Puerto Rico, Electrical and Computer Emgineering D | 10 |
| University of Florida | 4 |
| University of Florida, Department of Electrical and Computer Eng | 4 |
| Massachusetts Institute of Technology | 3 |
| UCSD, Calit2, UCSD | 3 |
| University of Innsbruck | 2 |
| INESC ID | 1 |
| USC | 1 |
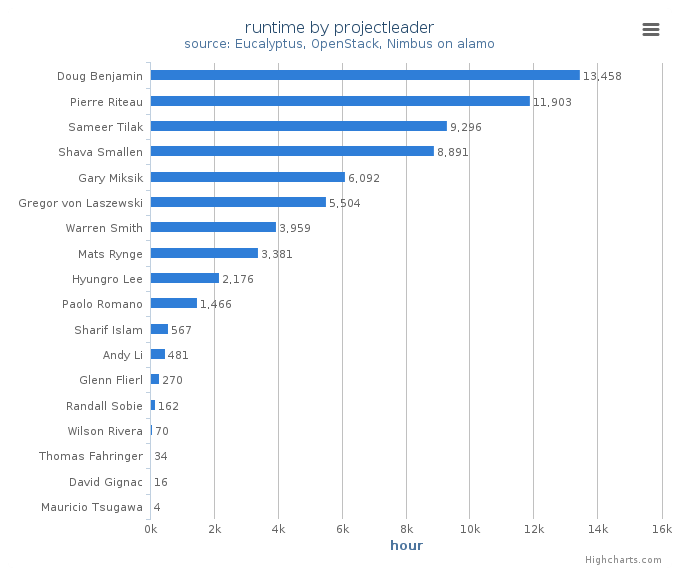
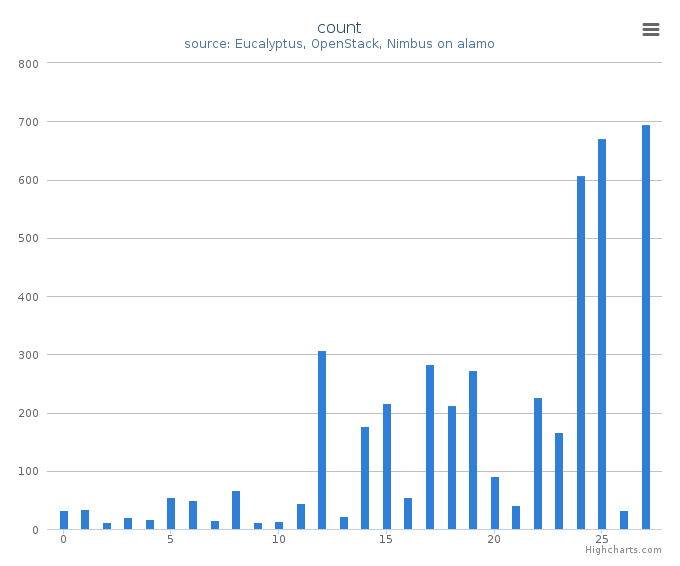
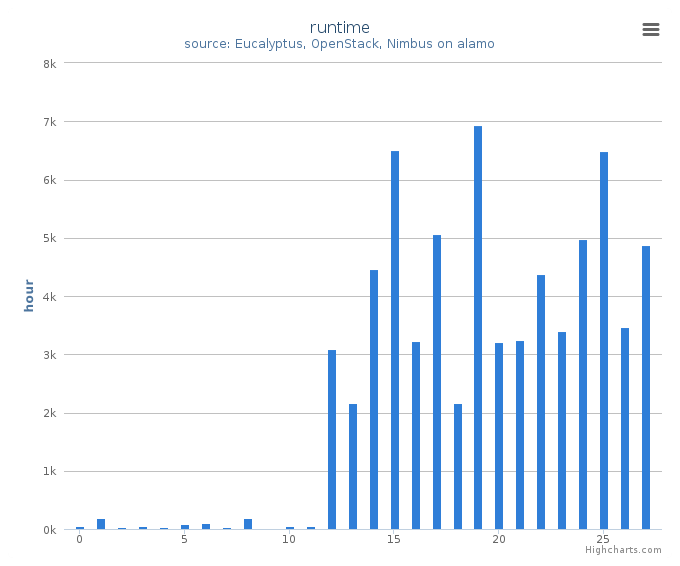
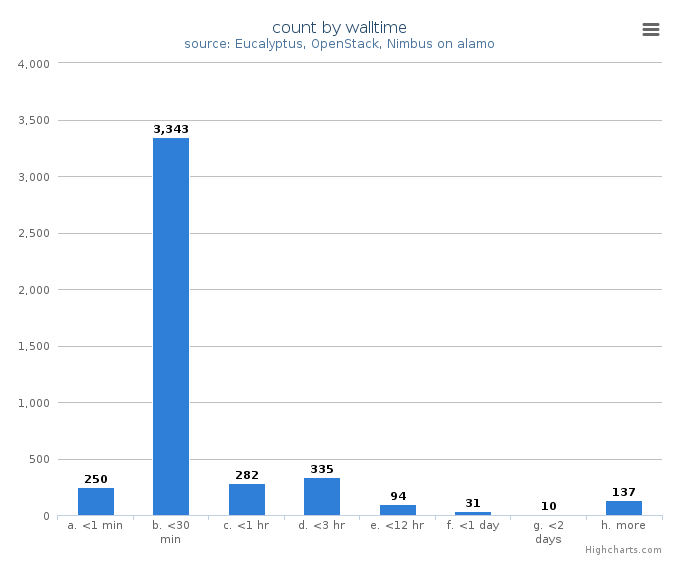
System information shows utilization distribution as to VMs count and wall time. Each cluster represents a compute node.