|
|
FutureGrid Cloud Metric |
|
|
FutureGrid Cloud Metric |
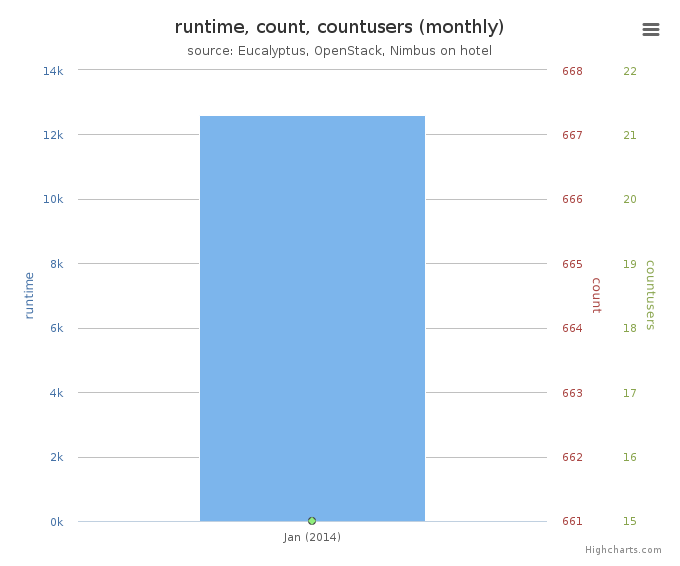
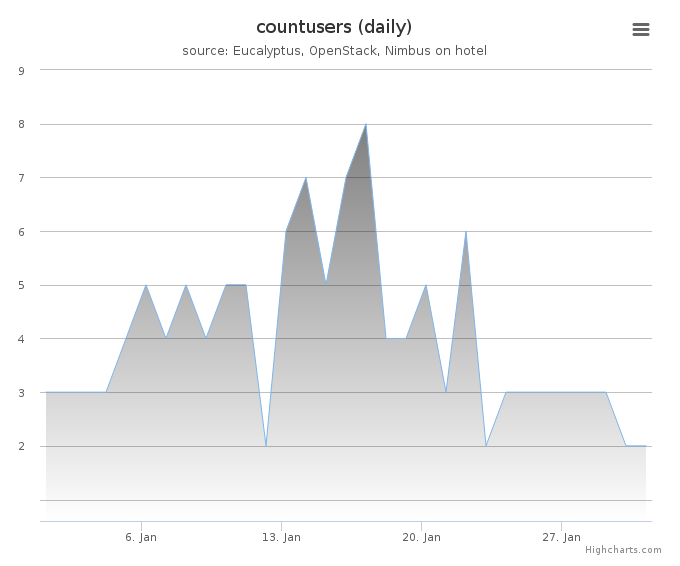
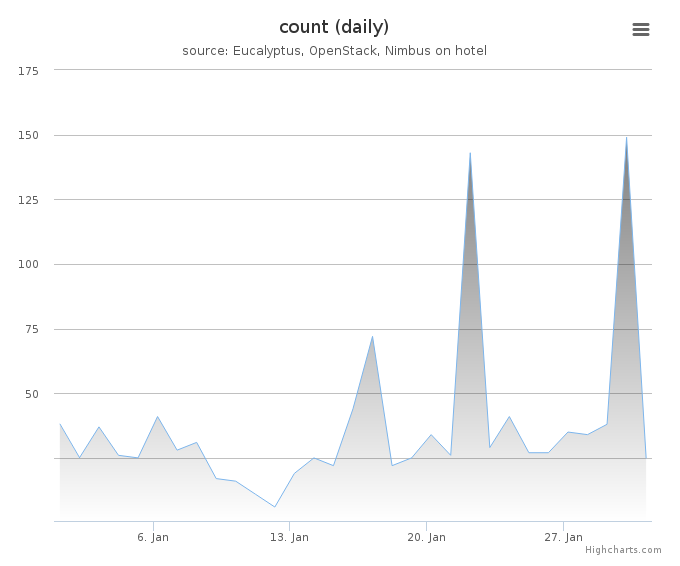
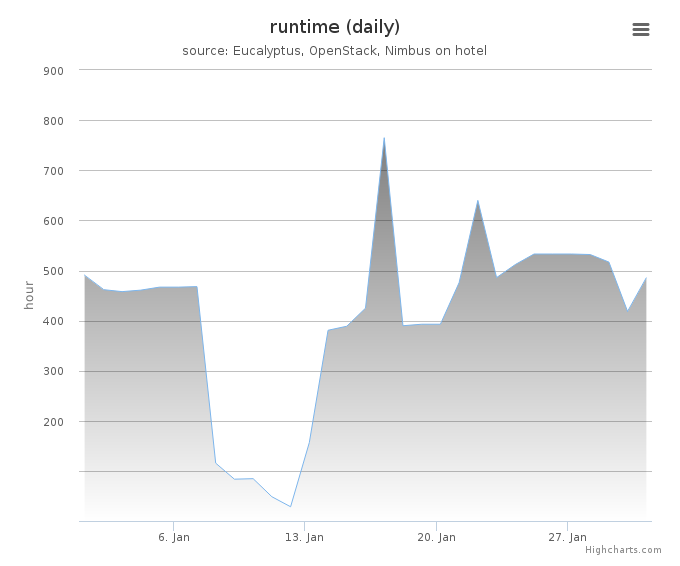
Period: January 01 – January 31, 2014
Cloud(IaaS): nimbus
Hostname: hotel
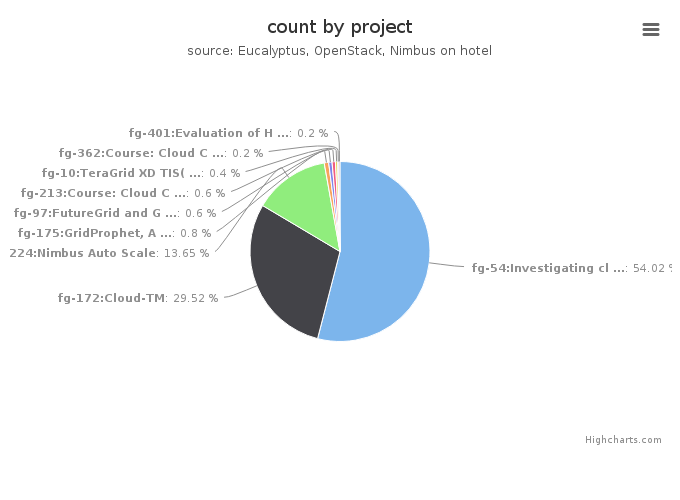
| Project | Value |
|---|---|
| fg-54:Investigating cloud computing as a solution for analyzing particle physics data | 269 |
| fg-172:Cloud-TM | 147 |
| fg-224:Nimbus Auto Scale | 68 |
| fg-175:GridProphet, A workflow execution time prediction system for the Grid | 4 |
| fg-97:FutureGrid and Grid‘5000 Collaboration | 3 |
| fg-213:Course: Cloud Computing class - second edition | 3 |
| fg-10:TeraGrid XD TIS(Technology Insertion Service) Technology Evaluation Laboratory | 2 |
| fg-362:Course: Cloud Computing and Storage (UF) | 1 |
| fg-401:Evaluation of HPC Applications on Cloud Resources | 1 |

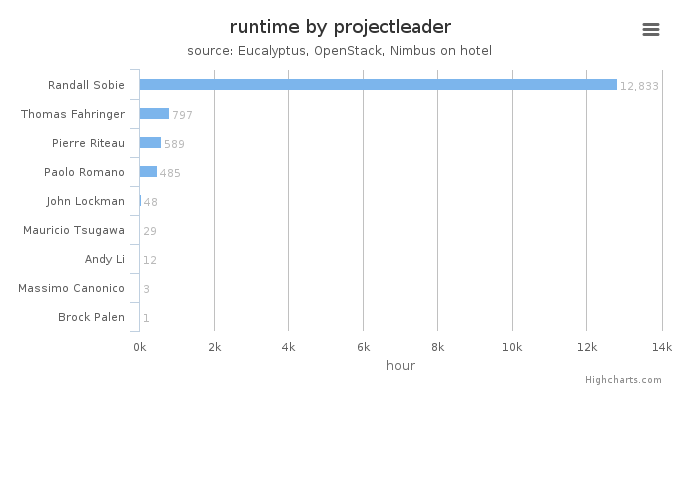
| Projectleader | Value |
|---|---|
| Randall Sobie | 269 |
| Paolo Romano | 147 |
| Pierre Riteau | 68 |
| Thomas Fahringer | 4 |
| Massimo Canonico | 3 |
| Mauricio Tsugawa | 3 |
| John Lockman | 2 |
| Brock Palen | 1 |
| Andy Li | 1 |
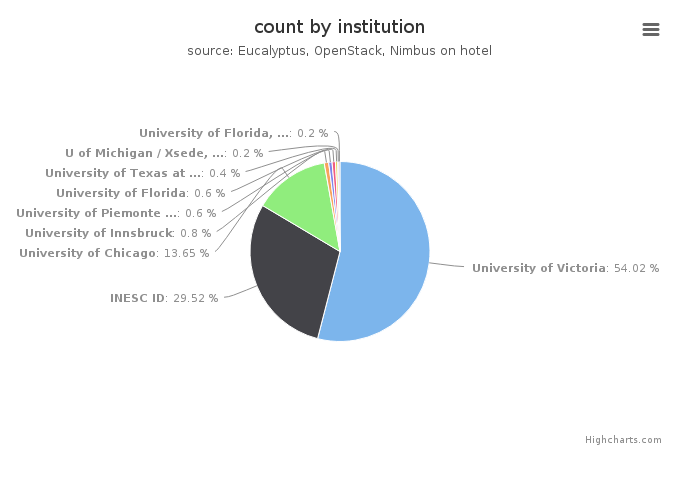
| Institution | Value |
|---|---|
| University of Victoria | 269 |
| INESC ID | 147 |
| University of Chicago | 68 |
| University of Innsbruck | 4 |
| University of Piemonte Orientale | 3 |
| University of Florida | 3 |
| University of Texas at Austin | 2 |
| U of Michigan / Xsede, CAEN HPC | 1 |
| University of Florida, Department of Electrical and Computer Eng | 1 |
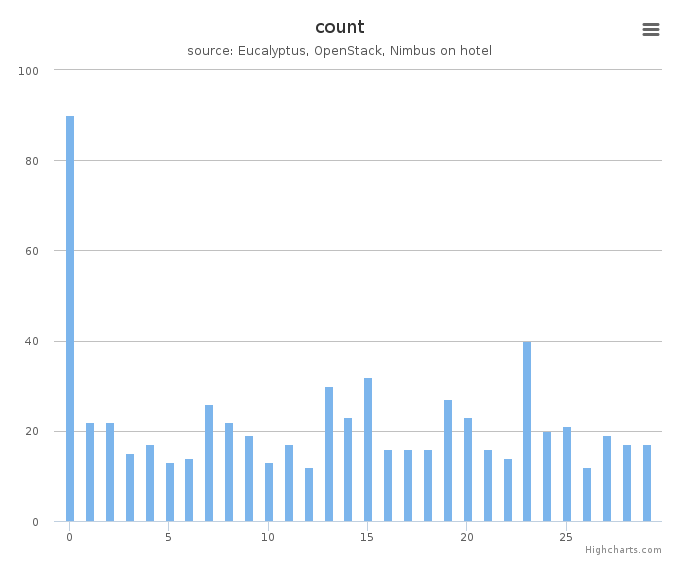
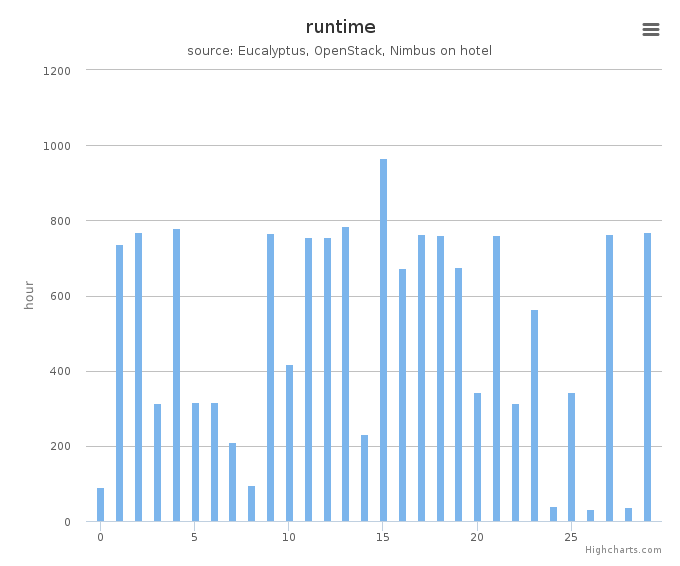
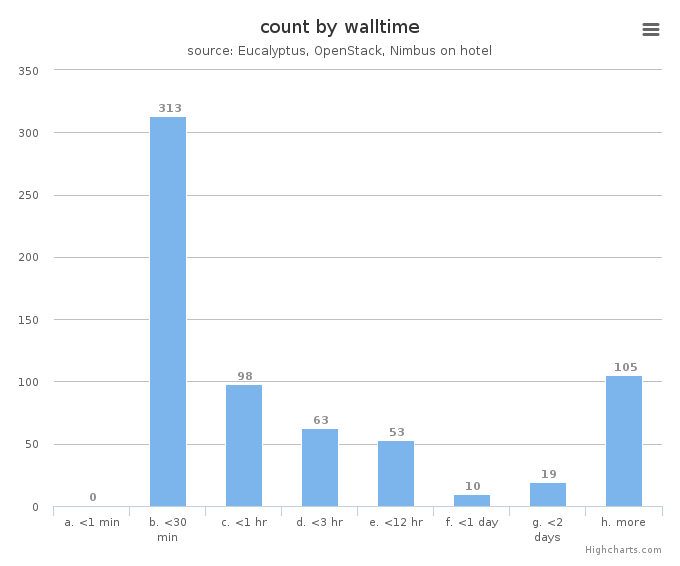
System information shows utilization distribution as to VMs count and wall time. Each cluster represents a compute node.