|
|
FutureGrid Cloud Metric |
|
|
FutureGrid Cloud Metric |
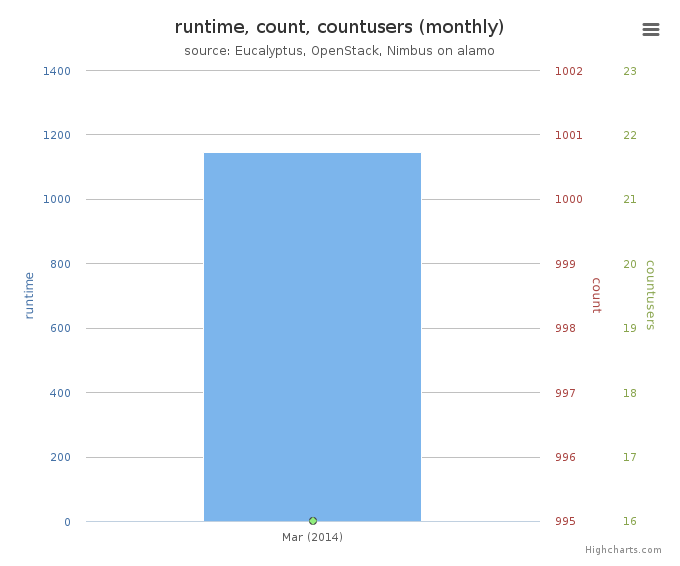
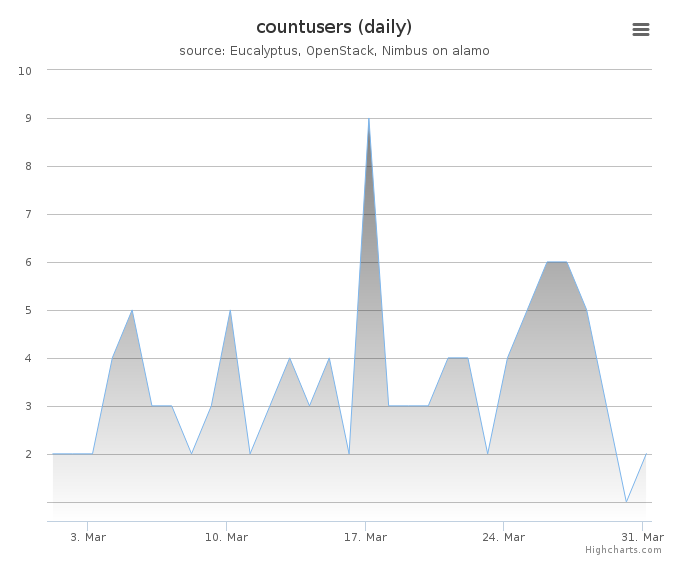
Period: March 01 – March 31, 2014
Cloud(IaaS): nimbus, openstack
Hostname: alamo
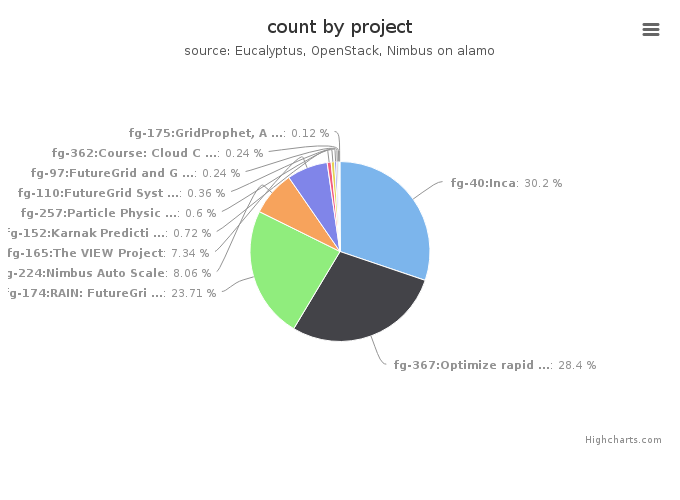
| Project | Value |
|---|---|
| fg-40:Inca | 251 |
| fg-367:Optimize rapid deployment and updating of VM images at the remote compute cluster | 236 |
| fg-174:RAIN: FutureGrid Dynamic provisioning Framework | 197 |
| fg-224:Nimbus Auto Scale | 67 |
| fg-165:The VIEW Project | 61 |
| fg-152:Karnak Prediction Service | 6 |
| fg-257:Particle Physics Data analysis cluster for ATLAS LHC experiment | 5 |
| fg-110:FutureGrid Systems Development | 3 |
| fg-97:FutureGrid and Grid‘5000 Collaboration | 2 |
| fg-362:Course: Cloud Computing and Storage (UF) | 2 |
| fg-175:GridProphet, A workflow execution time prediction system for the Grid | 1 |
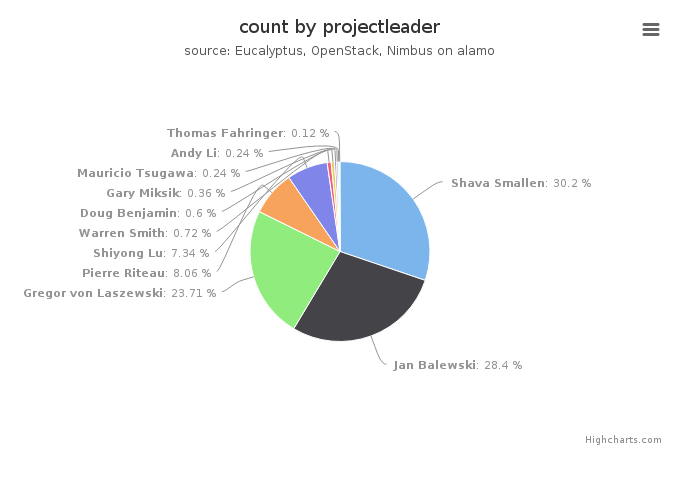
| Projectleader | Value |
|---|---|
| Shava Smallen | 251 |
| Jan Balewski | 236 |
| Gregor von Laszewski | 197 |
| Pierre Riteau | 67 |
| Shiyong Lu | 61 |
| Warren Smith | 6 |
| Doug Benjamin | 5 |
| Gary Miksik | 3 |
| Mauricio Tsugawa | 2 |
| Andy Li | 2 |
| Thomas Fahringer | 1 |
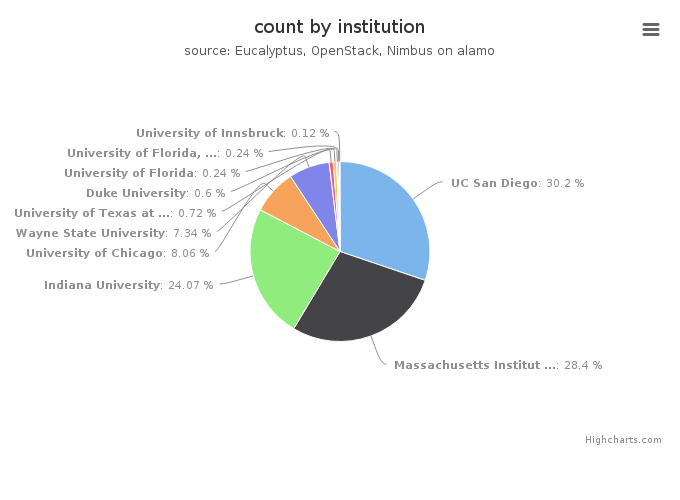
| Institution | Value |
|---|---|
| UC San Diego | 251 |
| Massachusetts Institute of Technology, Laboratory for Nuclear Sc | 236 |
| Indiana University | 200 |
| University of Chicago | 67 |
| Wayne State University | 61 |
| University of Texas at Austin | 6 |
| Duke University | 5 |
| University of Florida | 2 |
| University of Florida, Department of Electrical and Computer Eng | 2 |
| University of Innsbruck | 1 |
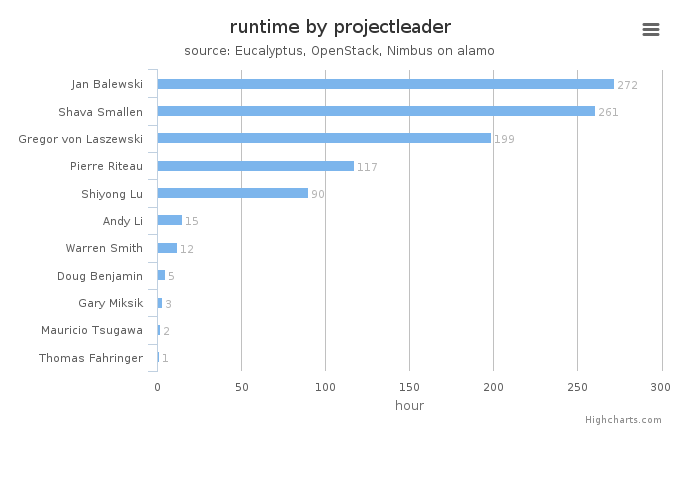
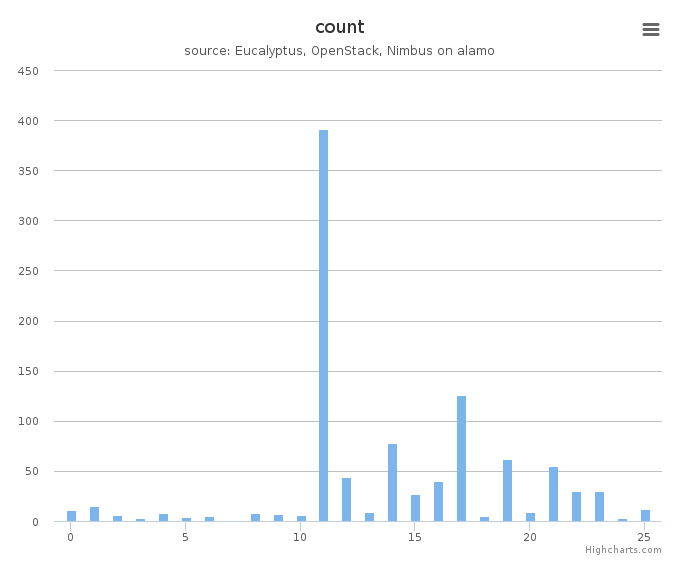
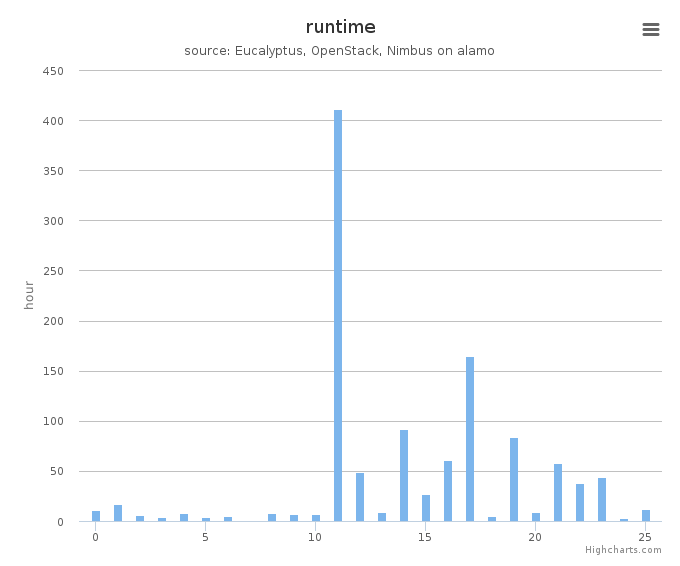
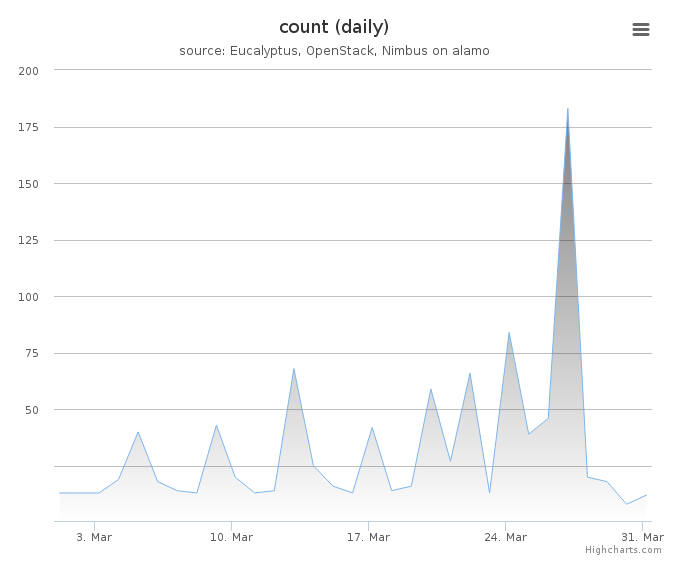
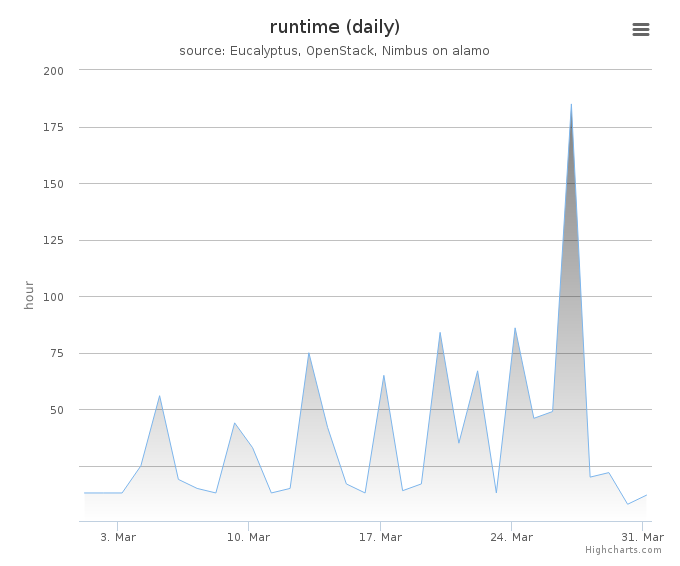
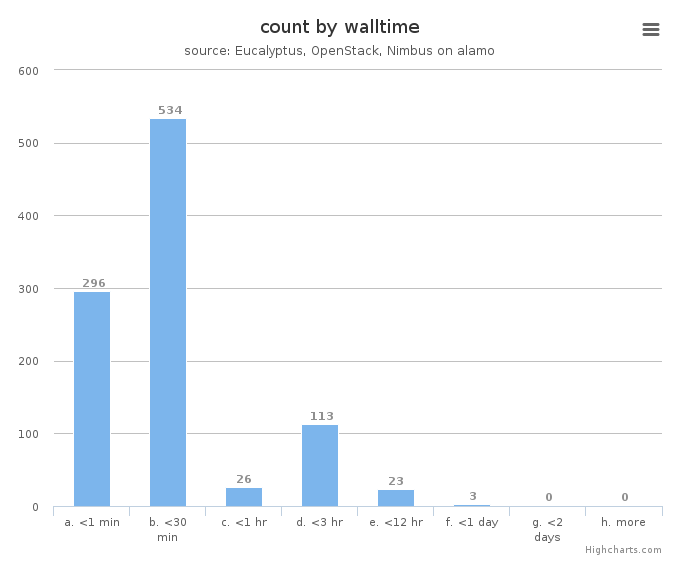
System information shows utilization distribution as to VMs count and wall time. Each cluster represents a compute node.