|
|
FutureGrid Cloud Metric |
|
|
FutureGrid Cloud Metric |
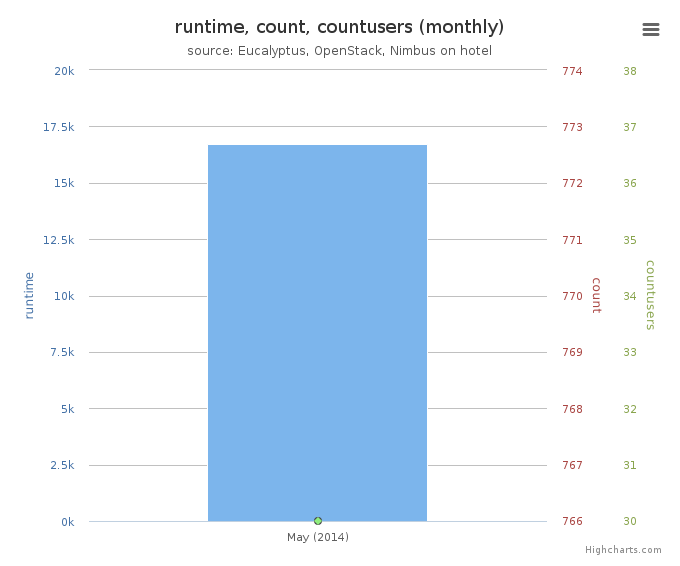
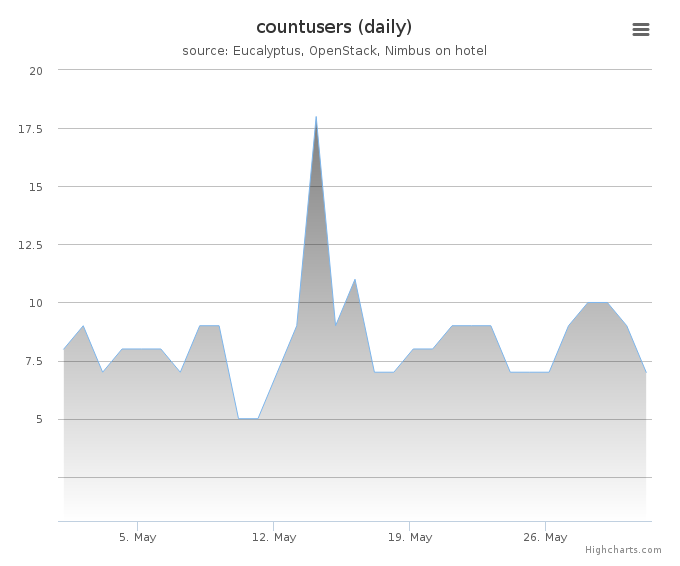
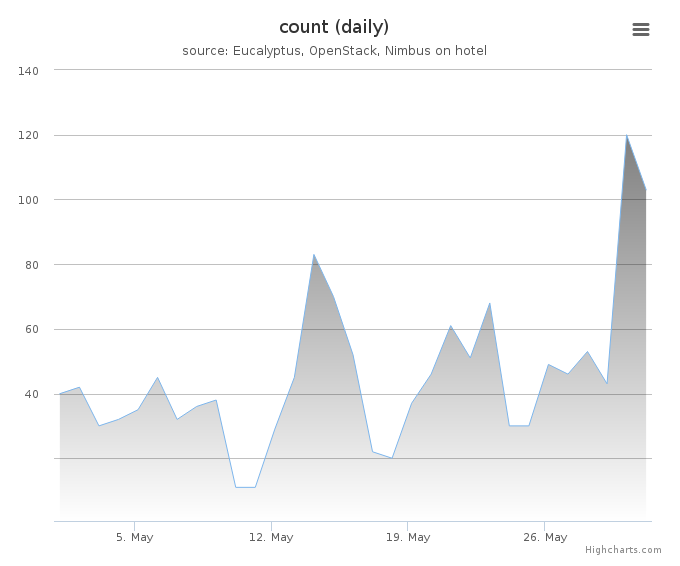
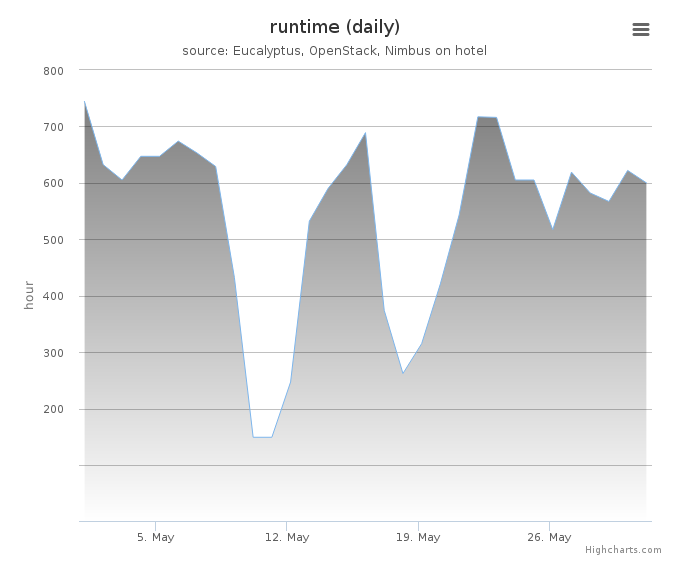
Period: May 01 – May 31, 2014
Cloud(IaaS): nimbus
Hostname: hotel
| Project | Value |
|---|---|
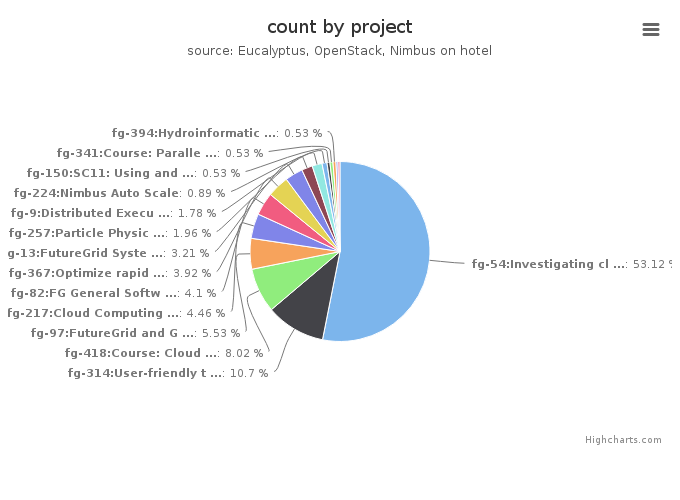
| fg-54:Investigating cloud computing as a solution for analyzing particle physics data | 298 |
| fg-314:User-friendly tools to play with cloud platforms | 60 |
| fg-418:Course: Cloud Computing Class - fourth edition | 45 |
| fg-97:FutureGrid and Grid‘5000 Collaboration | 31 |
| fg-217:Cloud Computing In Education | 25 |
| fg-82:FG General Software Development | 23 |
| fg-367:Optimize rapid deployment and updating of VM images at the remote compute cluster | 22 |
| fg-13:FutureGrid Systems Development and Prototyping | 18 |
| fg-257:Particle Physics Data analysis cluster for ATLAS LHC experiment | 11 |
| fg-9:Distributed Execution of Kepler Scientific Workflow on Future Grid | 10 |
| fg-224:Nimbus Auto Scale | 5 |
| fg-150:SC11: Using and Building Infrastructure Clouds for Science | 3 |
| fg-341:Course: Parallel Computing | 3 |
| fg-394:Hydroinformatics on the Cloud | 3 |
| fg-42:SAGA | 2 |
| fg-213:Course: Cloud Computing class - second edition | 2 |

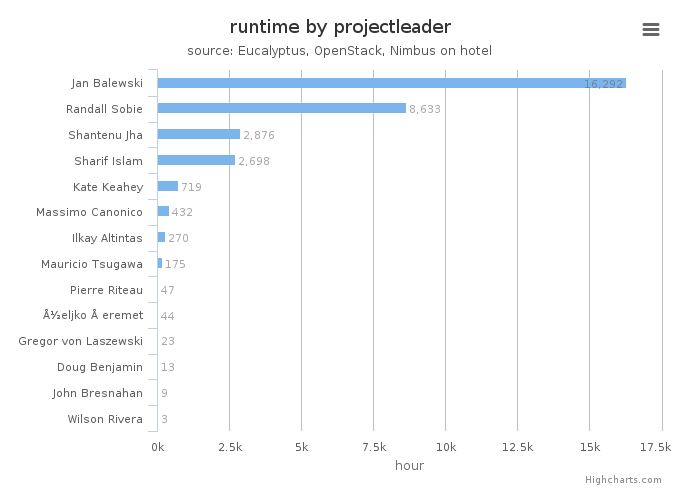
| Projectleader | Value |
|---|---|
| Randall Sobie | 298 |
| Massimo Canonico | 107 |
| Mauricio Tsugawa | 31 |
| Željko Šeremet | 25 |
| Gregor von Laszewski | 23 |
| Jan Balewski | 22 |
| Sharif Islam | 18 |
| Doug Benjamin | 11 |
| Ilkay Altintas | 10 |
| Pierre Riteau | 5 |
| John Bresnahan | 3 |
| Wilson Rivera | 3 |
| Kate Keahey | 3 |
| Shantenu Jha | 2 |
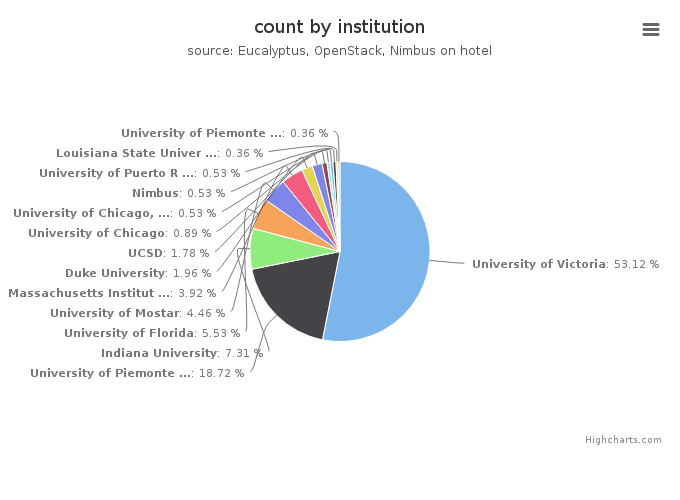
| Institution | Value |
|---|---|
| University of Victoria | 298 |
| University of Piemonte Orientale, Computer Science Department | 105 |
| Indiana University | 41 |
| University of Florida | 31 |
| University of Mostar | 25 |
| Massachusetts Institute of Technology, Laboratory for Nuclear Sc | 22 |
| Duke University | 11 |
| UCSD | 10 |
| University of Chicago | 5 |
| University of Chicago, Computation Institute | 3 |
| Nimbus | 3 |
| University of Puerto Rico, Electrical and Computer Emgineering D | 3 |
| Louisiana State University | 2 |
| University of Piemonte Orientale | 2 |
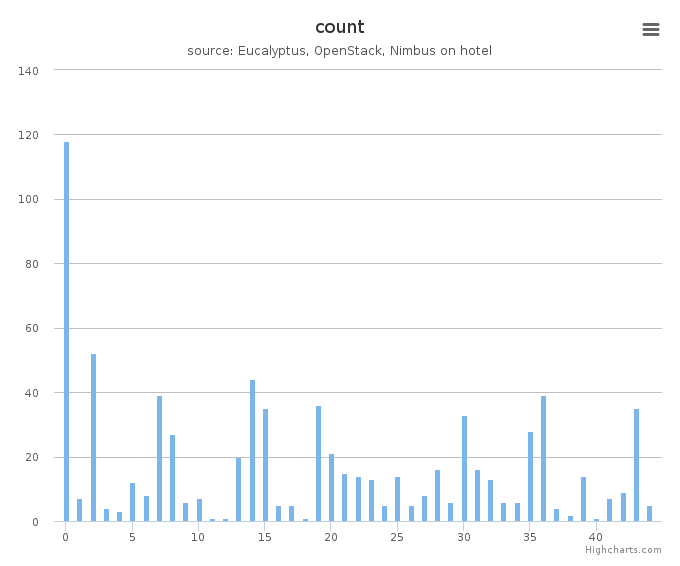
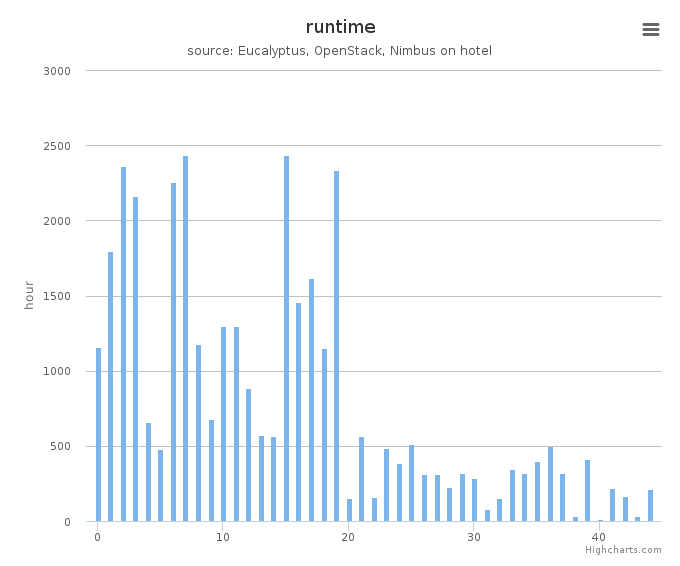
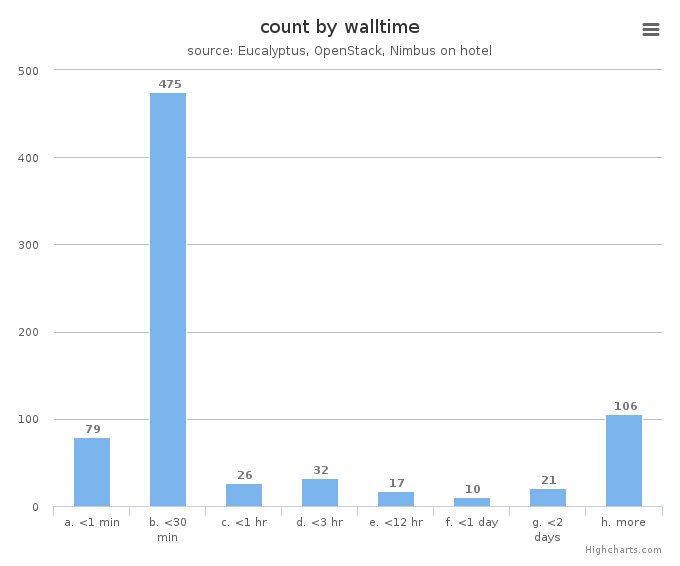
System information shows utilization distribution as to VMs count and wall time. Each cluster represents a compute node.