|
|
FutureGrid Cloud Metric |
|
|
FutureGrid Cloud Metric |
Period: May 01 – May 31, 2014
Cloud(IaaS): nimbus, openstack, eucalyptus
Hostname: sierra
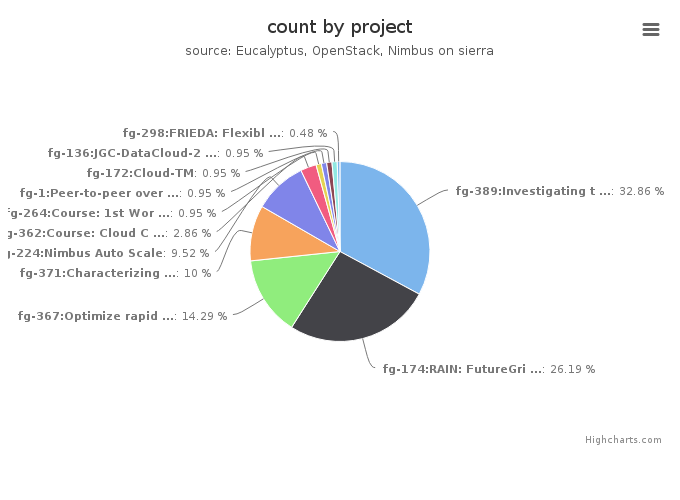
| Project | Value |
|---|---|
| fg-389:Investigating the Apache Big Data Stack | 69 |
| fg-174:RAIN: FutureGrid Dynamic provisioning Framework | 55 |
| fg-367:Optimize rapid deployment and updating of VM images at the remote compute cluster | 30 |
| fg-371:Characterizing Infrastructure Cloud Performance for Scientific Computing | 21 |
| fg-224:Nimbus Auto Scale | 20 |
| fg-362:Course: Cloud Computing and Storage (UF) | 6 |
| fg-264:Course: 1st Workshop on bioKepler Tools and Its Applications | 2 |
| fg-1:Peer-to-peer overlay networks and applications in virtual networks and virtual clusters | 2 |
| fg-172:Cloud-TM | 2 |
| fg-136:JGC-DataCloud-2012 paper experiments | 2 |
| fg-298:FRIEDA: Flexible Robust Intelligent Elastic Data Management | 1 |
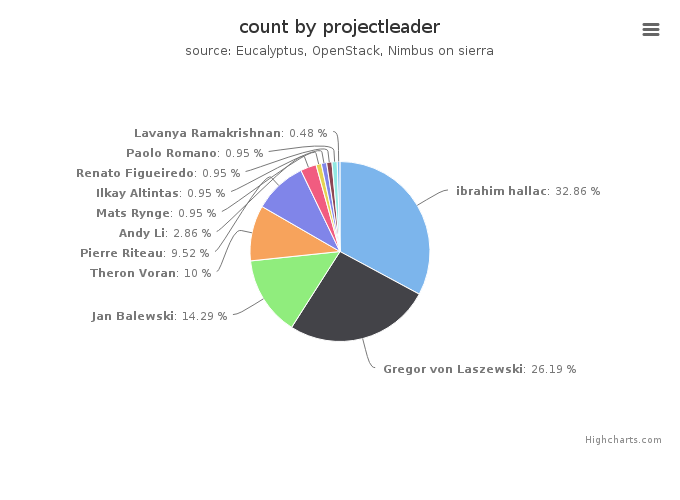
| Projectleader | Value |
|---|---|
| ibrahim hallac | 69 |
| Gregor von Laszewski | 55 |
| Jan Balewski | 30 |
| Theron Voran | 21 |
| Pierre Riteau | 20 |
| Andy Li | 6 |
| Mats Rynge | 2 |
| Ilkay Altintas | 2 |
| Renato Figueiredo | 2 |
| Paolo Romano | 2 |
| Lavanya Ramakrishnan | 1 |
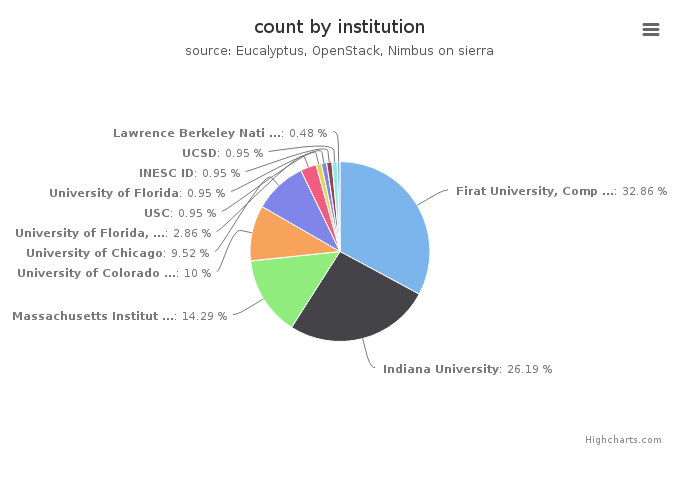
| Institution | Value |
|---|---|
| Firat University, Computer Science Department | 69 |
| Indiana University | 55 |
| Massachusetts Institute of Technology, Laboratory for Nuclear Sc | 30 |
| University of Colorado at Boulder, Computer Science Department | 21 |
| University of Chicago | 20 |
| University of Florida, Department of Electrical and Computer Eng | 6 |
| USC | 2 |
| University of Florida | 2 |
| INESC ID | 2 |
| UCSD | 2 |
| Lawrence Berkeley National Lab | 1 |
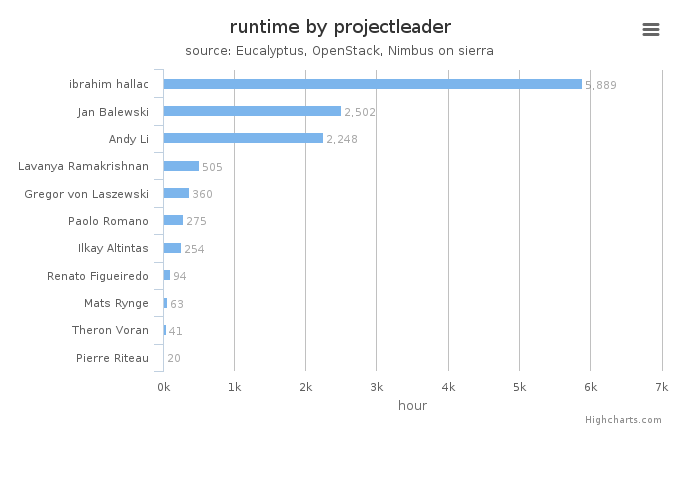
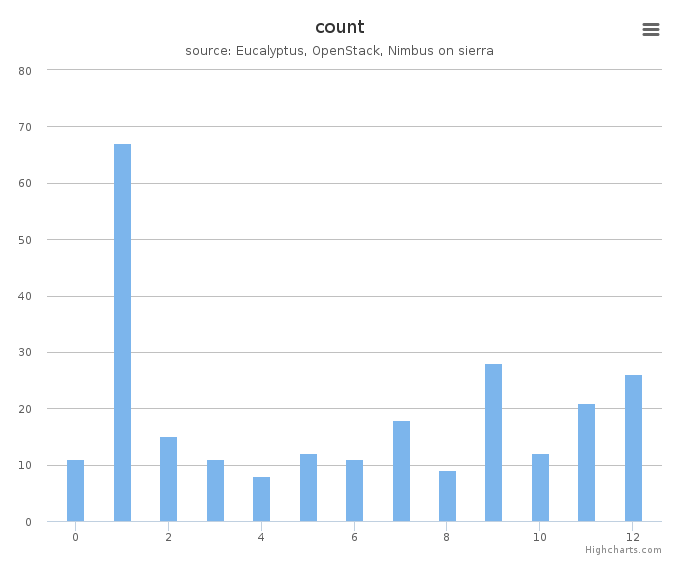
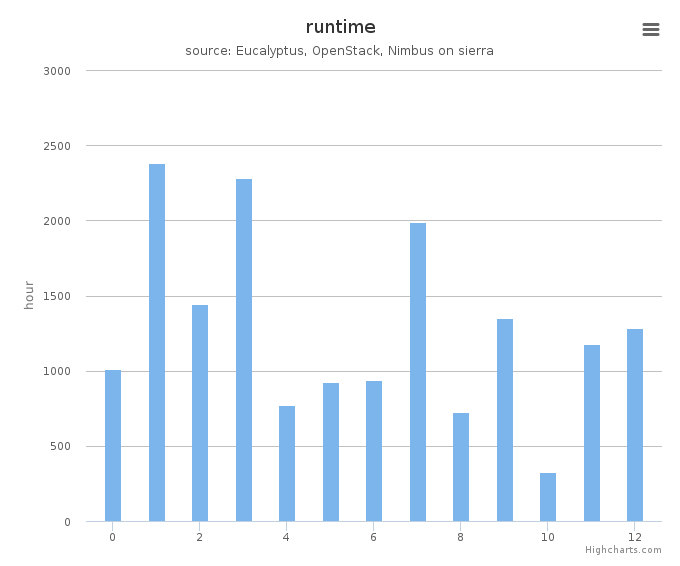
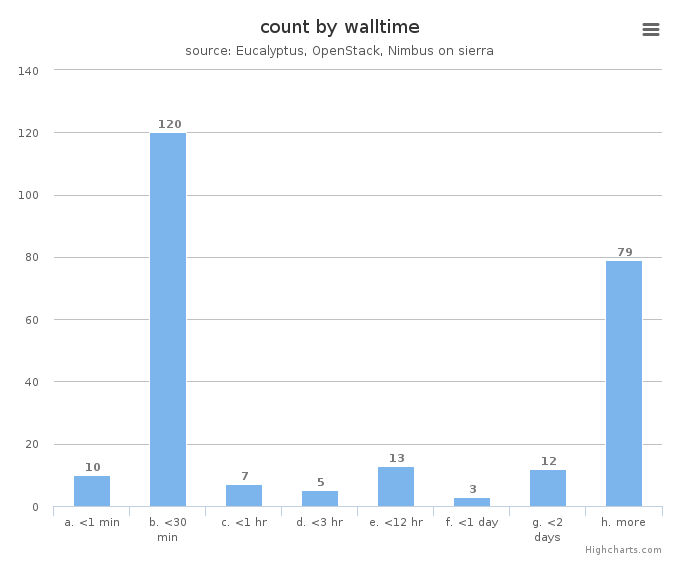
System information shows utilization distribution as to VMs count and wall time. Each cluster represents a compute node.