|
|
FutureGrid Cloud Metric |
|
|
FutureGrid Cloud Metric |
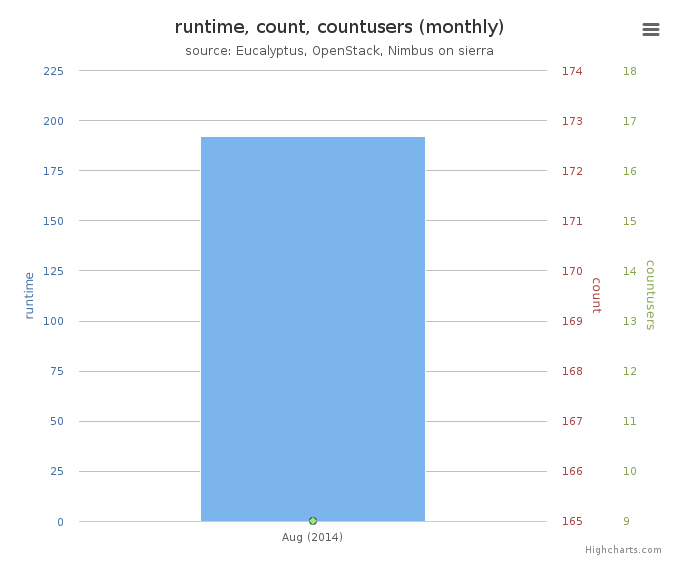
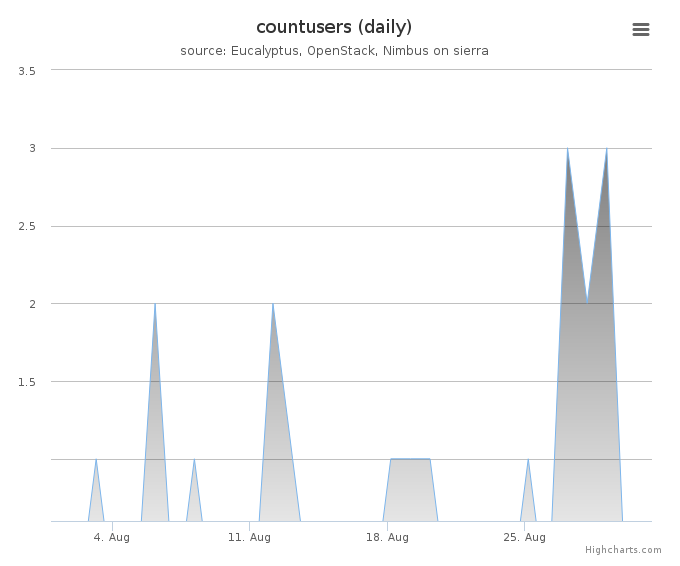
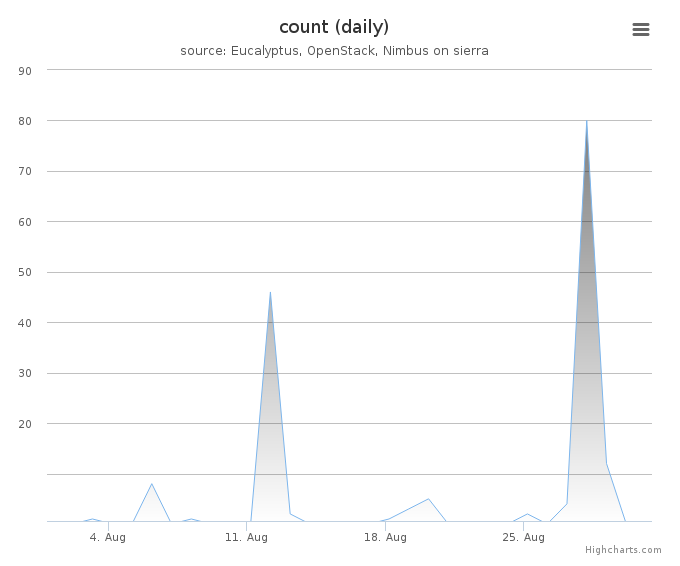
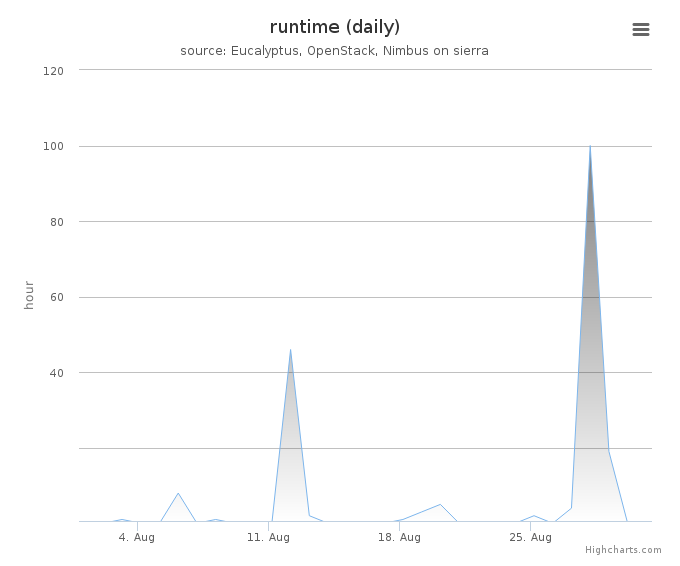
Period: August 01 – August 31, 2014
Cloud(IaaS): nimbus, openstack, eucalyptus
Hostname: sierra
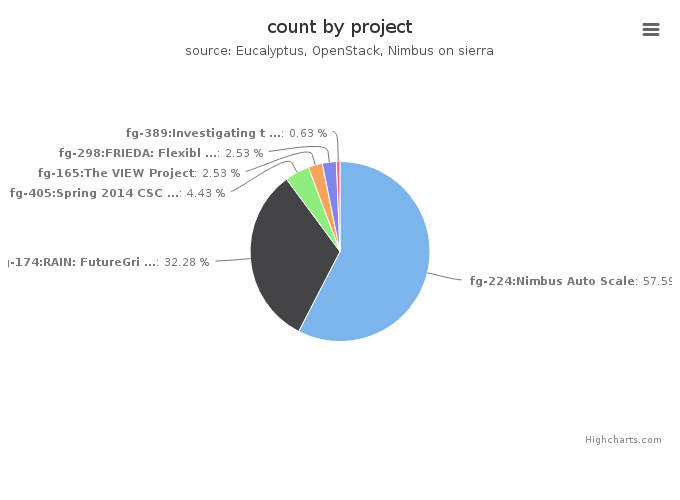
| Project | Value |
|---|---|
| fg-224:Nimbus Auto Scale | 91 |
| fg-174:RAIN: FutureGrid Dynamic provisioning Framework | 51 |
| fg-405:Spring 2014 CSCI-B649 Cloud Computing MOOC for residential and online students | 7 |
| fg-165:The VIEW Project | 4 |
| fg-298:FRIEDA: Flexible Robust Intelligent Elastic Data Management | 4 |
| fg-389:Investigating the Apache Big Data Stack | 1 |
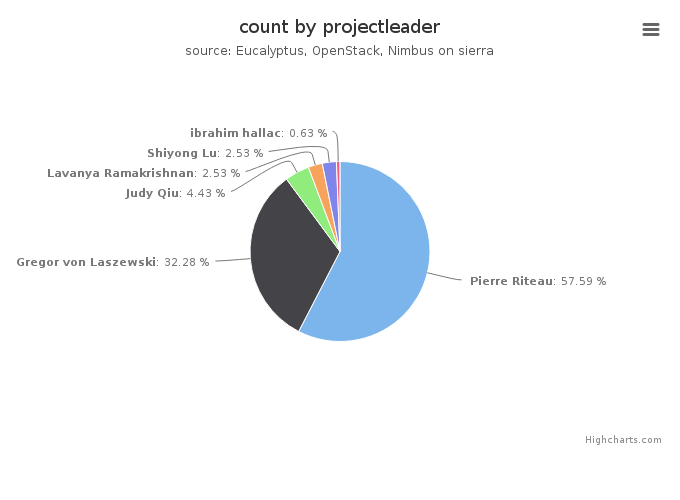
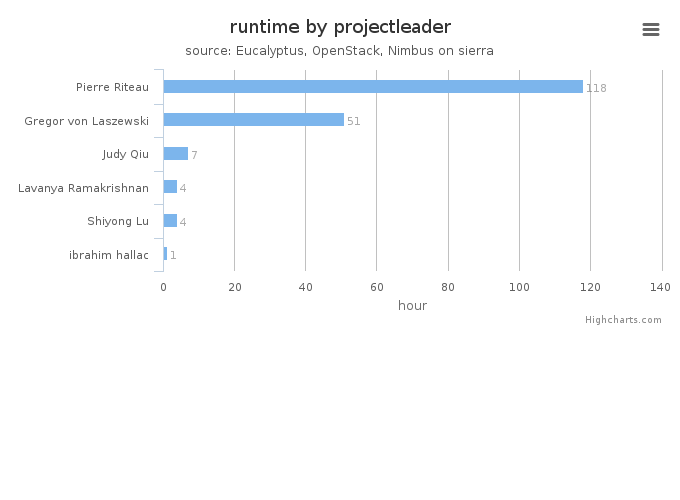
| Projectleader | Value |
|---|---|
| Pierre Riteau | 91 |
| Gregor von Laszewski | 51 |
| Judy Qiu | 7 |
| Lavanya Ramakrishnan | 4 |
| Shiyong Lu | 4 |
| ibrahim hallac | 1 |
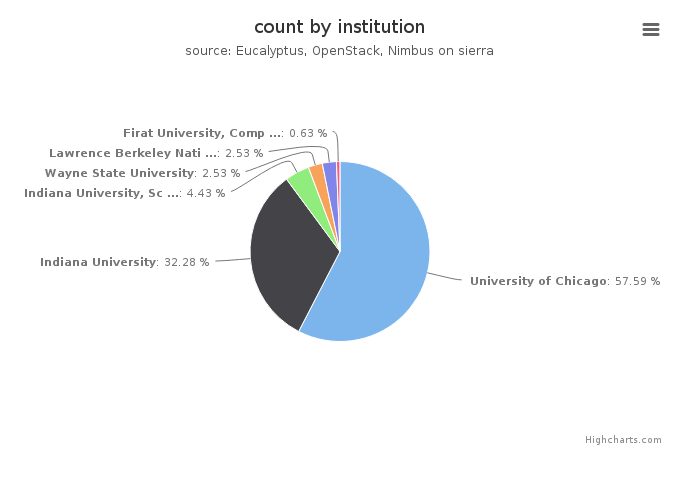
| Institution | Value |
|---|---|
| University of Chicago | 91 |
| Indiana University | 51 |
| Indiana University, School of Informatics and Computing | 7 |
| Wayne State University | 4 |
| Lawrence Berkeley National Lab | 4 |
| Firat University, Computer Science Department | 1 |
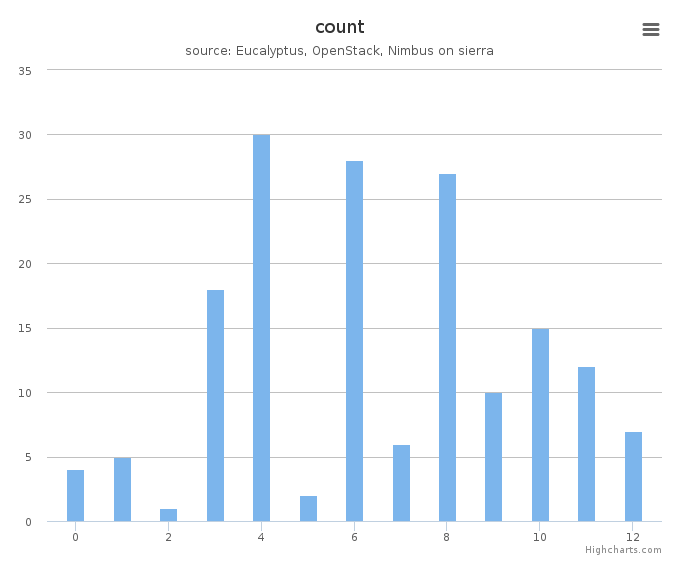
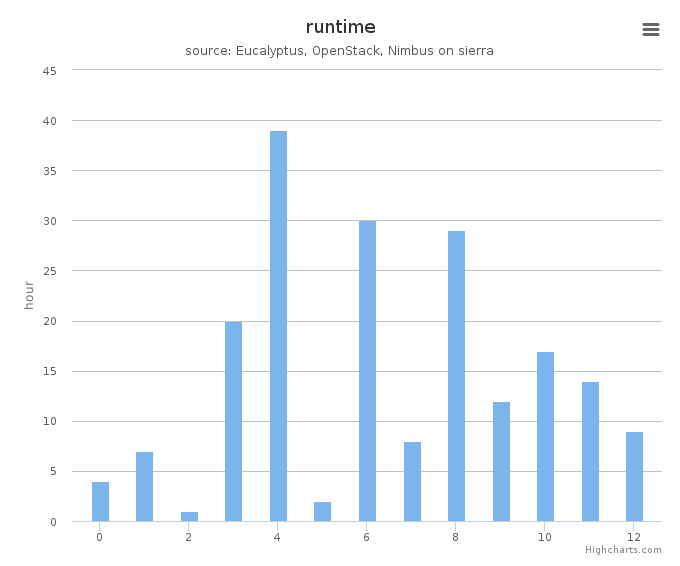
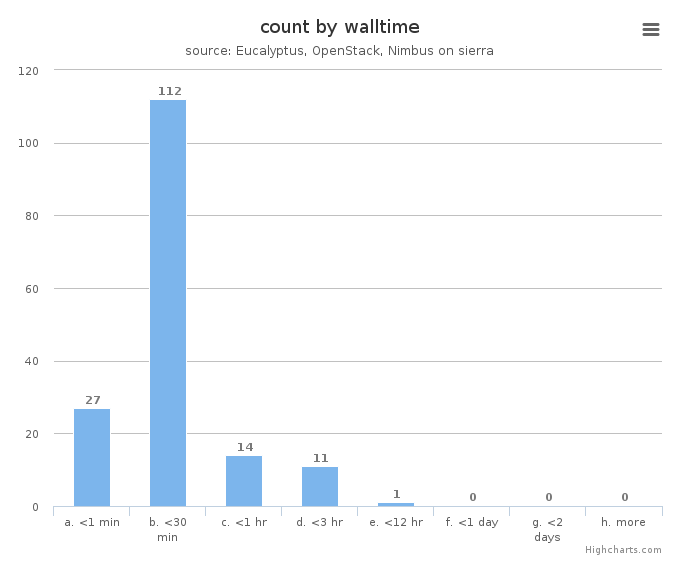
System information shows utilization distribution as to VMs count and wall time. Each cluster represents a compute node.