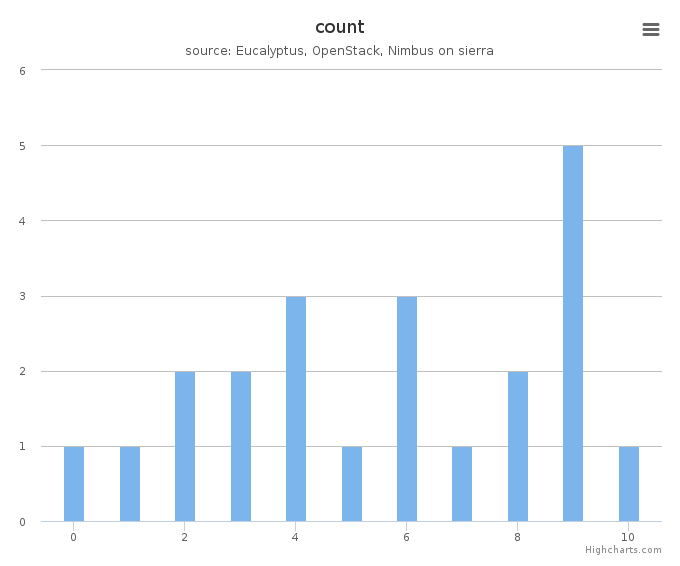
Distribution
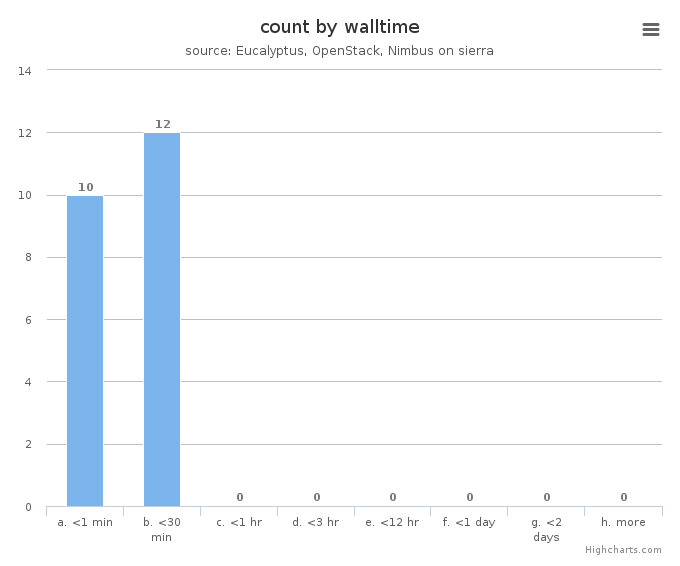
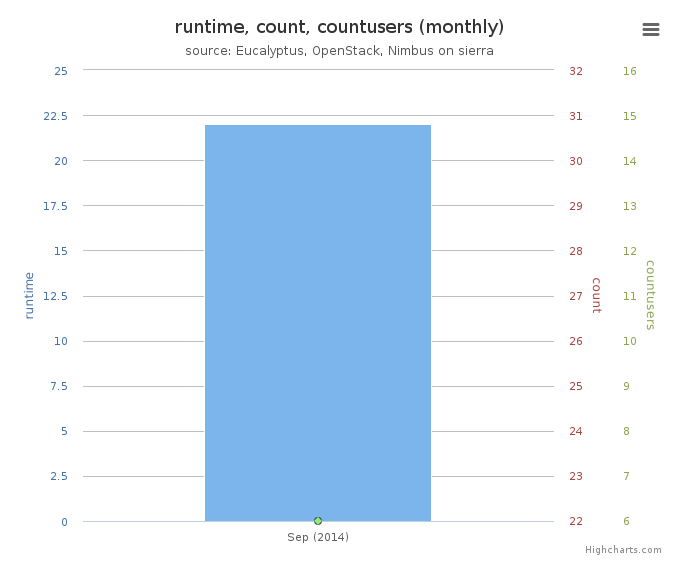
Figure 5: VM count by wall time
This chart illustrates usage patterns of VM instances in terms of running wall time.
- Period: September 01 – September 30, 2014
- Cloud(IaaS): nimbus, openstack, eucalyptus
- Hostname: sierra
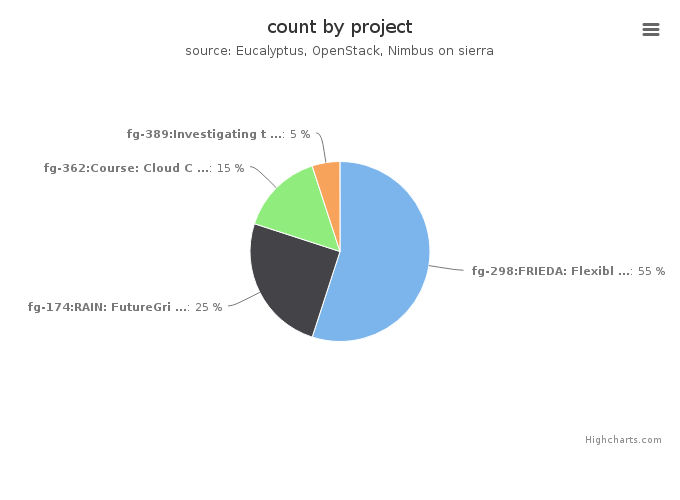
Figure 6: VMs count by project
This chart illustrates the proportion of launched VM instances by project groups. The same data in tabular form follows.
- Period: September 01 – September 30, 2014
- Cloud(IaaS): nimbus, openstack, eucalyptus
- Hostname: sierra
VMs count by project
| Project |
Value |
|---|
| fg-298:FRIEDA: Flexible Robust Intelligent Elastic Data Management |
11 |
| fg-174:RAIN: FutureGrid Dynamic provisioning Framework |
5 |
| fg-362:Course: Cloud Computing and Storage (UF) |
3 |
| fg-389:Investigating the Apache Big Data Stack |
1 |
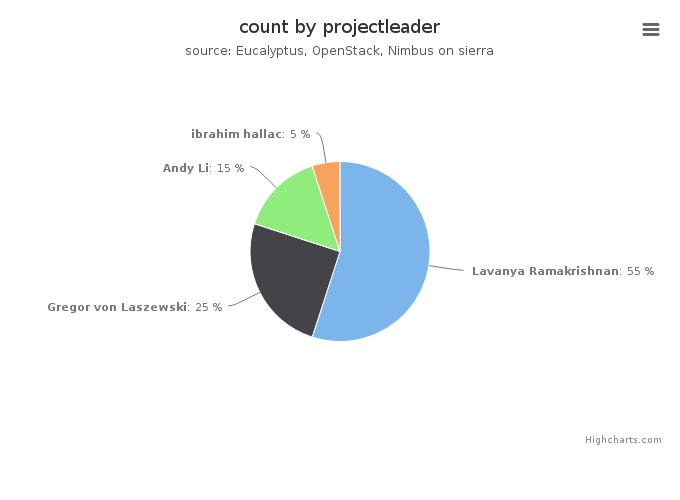
Figure 7: VMs count by project leader
This chart also illustrates the proportion of launched VM instances by project Leader. The same data in tabular form follows.
- Period: September 01 – September 30, 2014
- Cloud(IaaS): nimbus, openstack, eucalyptus
- Hostname: sierra
VMs count by project leader
| Projectleader |
Value |
|---|
| Lavanya Ramakrishnan |
11 |
| Gregor von Laszewski |
5 |
| Andy Li |
3 |
| ibrahim hallac |
1 |

Figure 8: VMs count by institution
This chart illustrates the proportion of launched VM instances by Institution. The same data in tabular form follows.
- Period: September 01 – September 30, 2014
- Cloud(IaaS): nimbus, openstack, eucalyptus
- Hostname: sierra
VMs count by institution
| Institution |
Value |
|---|
| Lawrence Berkeley National Lab |
11 |
| Indiana University |
5 |
| University of Florida, Department of Electrical and Computer Eng |
3 |
| Firat University, Computer Science Department |
1 |
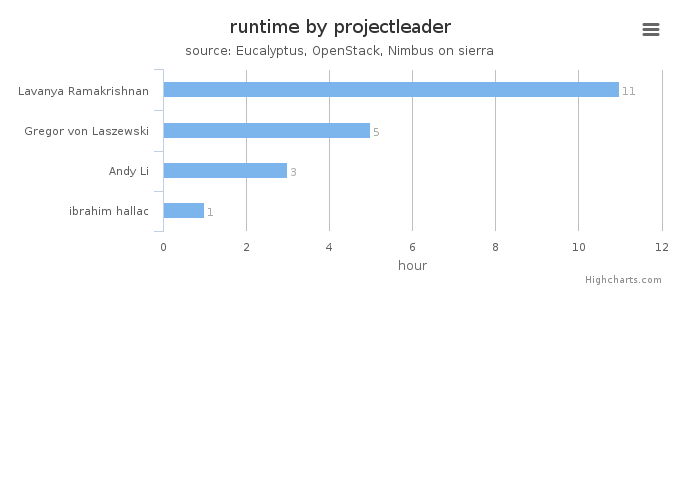
Figure 9: Wall time (hours) by project leader
This chart illustrates proportionate total run times by project leader.
- Period: September 01 – September 30, 2014
- Cloud(IaaS): nimbus, openstack, eucalyptus
- Hostname: sierra