|
|
FutureGrid Cloud Metric |
|
|
FutureGrid Cloud Metric |
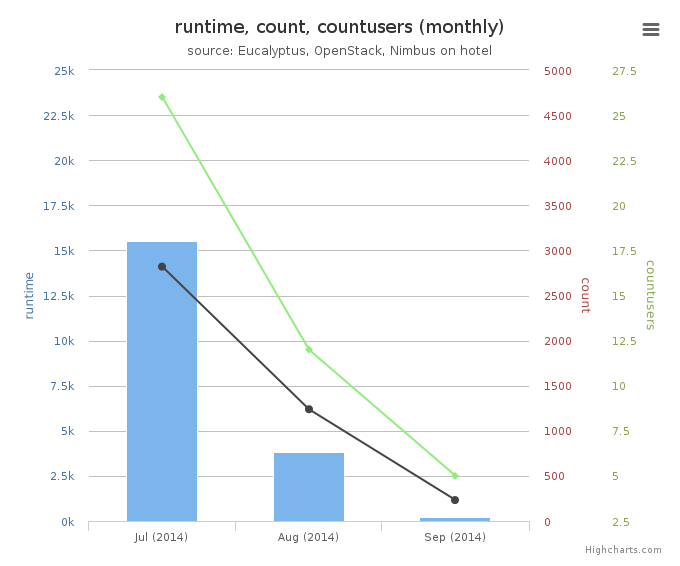
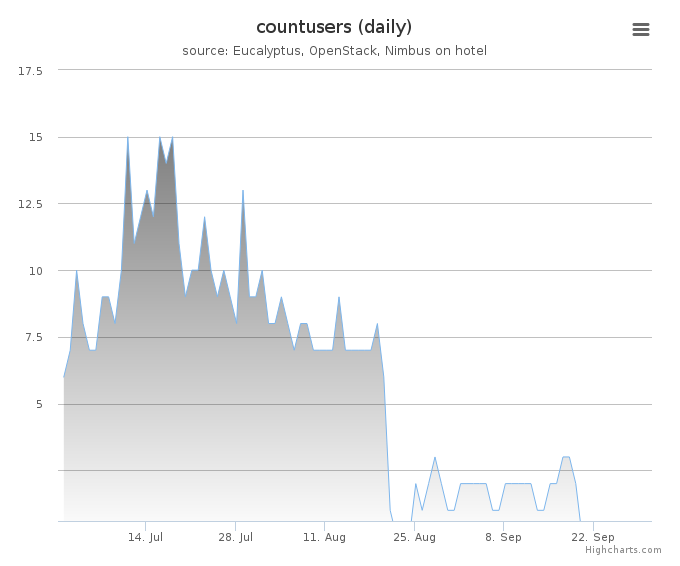
Period: July 01 – September 30, 2014
Cloud(IaaS): nimbus
Hostname: hotel
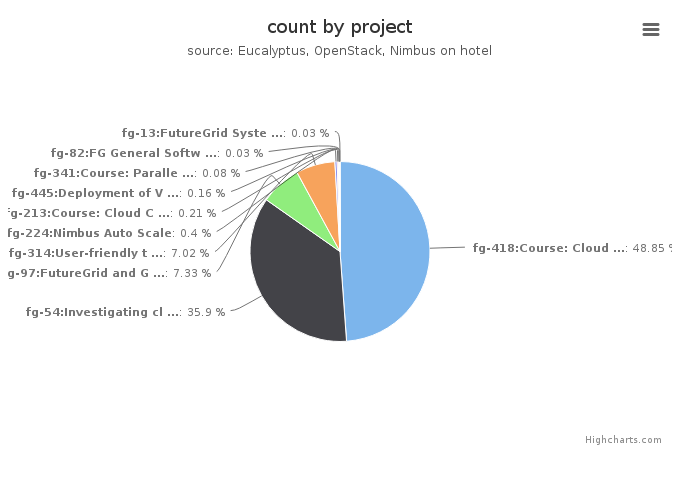
| Project | Value |
|---|---|
| fg-418:Course: Cloud Computing Class - fourth edition | 1845 |
| fg-54:Investigating cloud computing as a solution for analyzing particle physics data | 1356 |
| fg-97:FutureGrid and Grid‘5000 Collaboration | 277 |
| fg-314:User-friendly tools to play with cloud platforms | 265 |
| fg-224:Nimbus Auto Scale | 15 |
| fg-213:Course: Cloud Computing class - second edition | 8 |
| fg-445:Deployment of Virtual Clusters on a Commercial Cloud Platform for Molecular Docking | 6 |
| fg-341:Course: Parallel Computing | 3 |
| fg-82:FG General Software Development | 1 |
| fg-13:FutureGrid Systems Development and Prototyping | 1 |
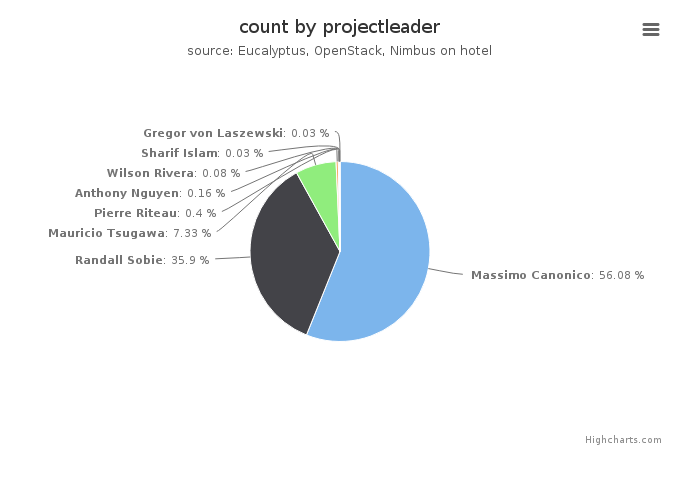
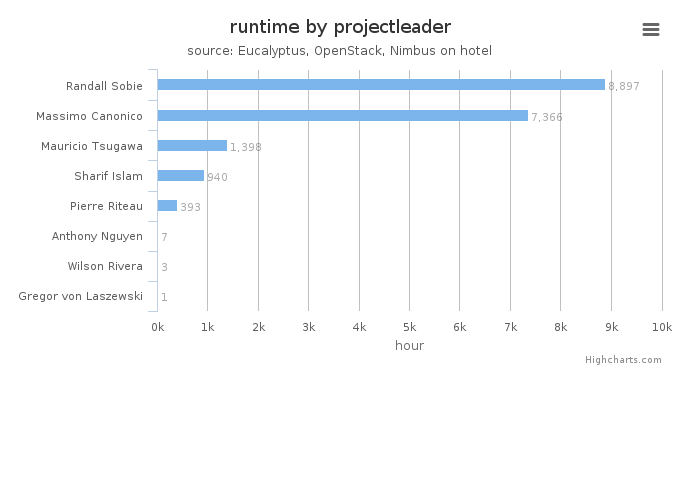
| Projectleader | Value |
|---|---|
| Massimo Canonico | 2118 |
| Randall Sobie | 1356 |
| Mauricio Tsugawa | 277 |
| Pierre Riteau | 15 |
| Anthony Nguyen | 6 |
| Wilson Rivera | 3 |
| Sharif Islam | 1 |
| Gregor von Laszewski | 1 |
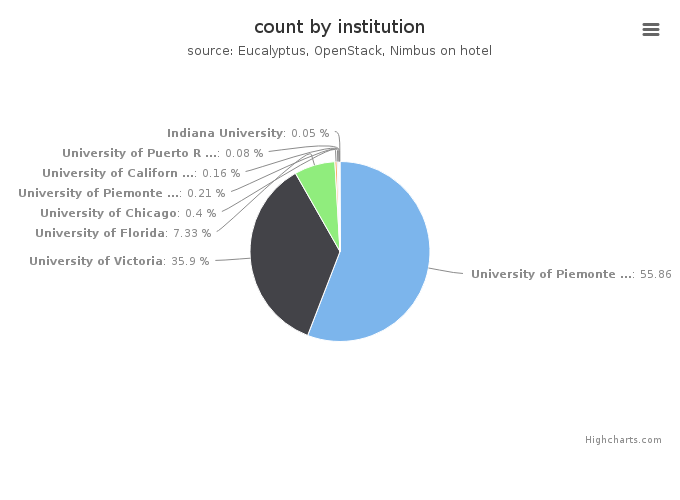
| Institution | Value |
|---|---|
| University of Piemonte Orientale, Computer Science Department | 2110 |
| University of Victoria | 1356 |
| University of Florida | 277 |
| University of Chicago | 15 |
| University of Piemonte Orientale | 8 |
| University of California, San Diego, PRIME/PRAGMA | 6 |
| University of Puerto Rico, Electrical and Computer Emgineering D | 3 |
| Indiana University | 2 |
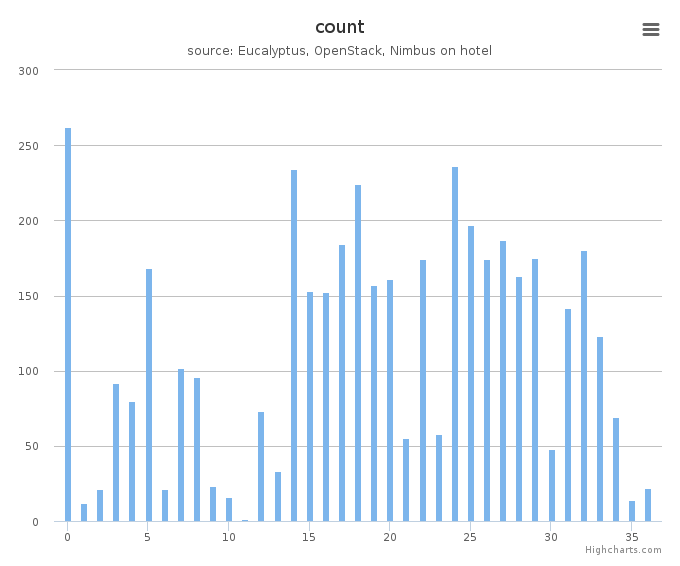
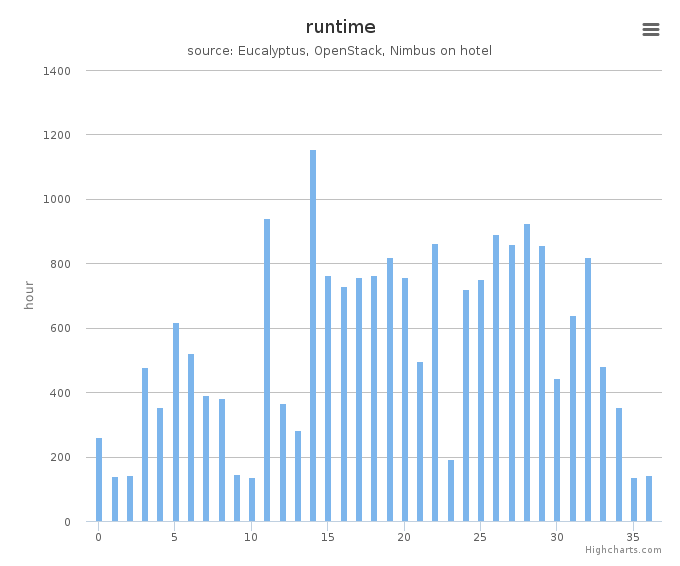
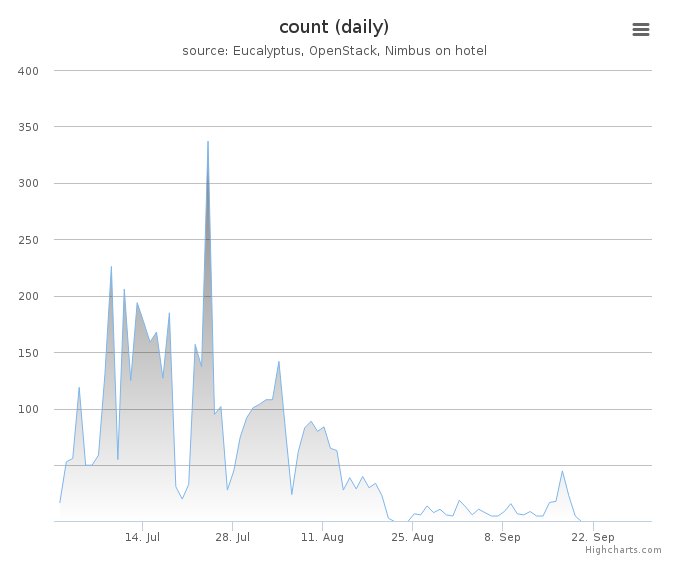
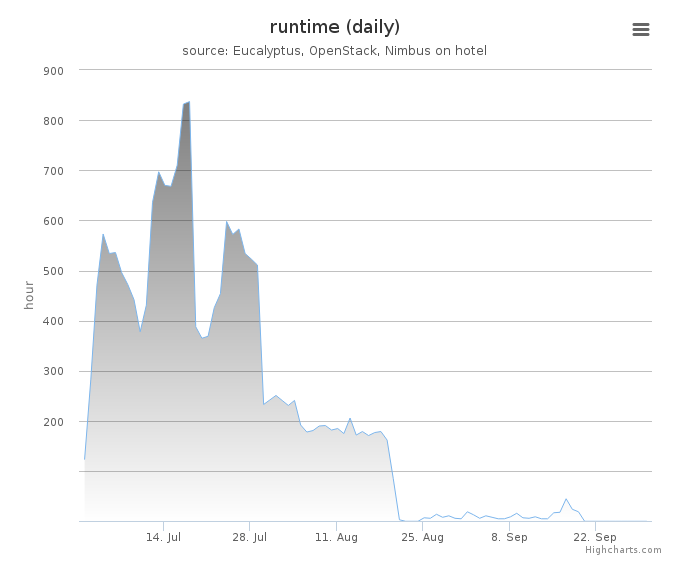
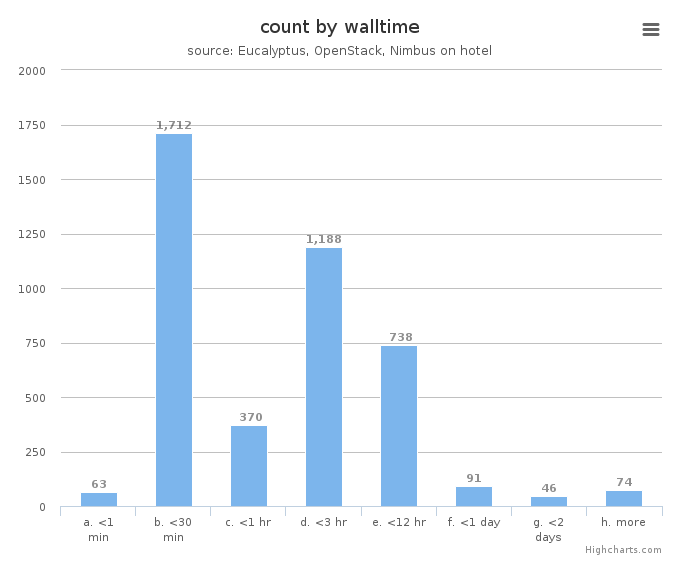
System information shows utilization distribution as to VMs count and wall time. Each cluster represents a compute node.