FutureGrid Cloud Metric FutureGrid

Cloud Metric

Table Of Contents

Previous topic

Summary Report (All)

Next topic

Usage Report india

This Page

Usage Report sierra

  • Period: July 01 – September 30, 2014
  • Hostname: sierra.futuregrid.org
  • Services: nimbus, openstack, eucalyptus
  • Metrics: VMs count, Users count, Wall time (hours), Distribution by wall time, project, project leader, and institution, and systems

Histogram

Summary (Monthly)

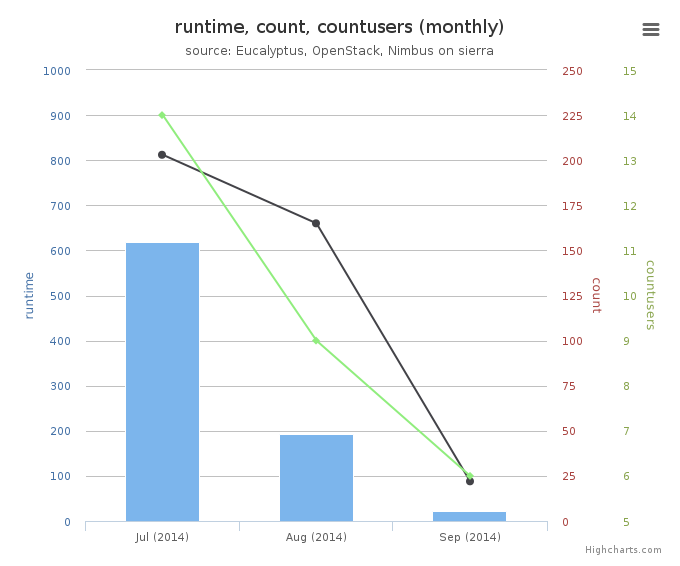
Average Monthly Usage Data (Wall time, Launched VMs, Users)
Figure 1: Average monthly usage data (wall time (hour), launched VMs, users)
This mixed chart represents average monthly usage as to wall time (hour), the number of VM instances and active users.
  • Period: July 01 – September 30, 2014

  • Cloud(IaaS): nimbus, openstack, eucalyptus

  • Hostname: sierra

  • Metric:
    • Runtime (Wall time hours): Sum of time elapsed from launch to termination of VM instances
    • Count (VM count): The number of launched VM instances
    • User count (Active): The number of users who launched VMs

Summary (Daily)

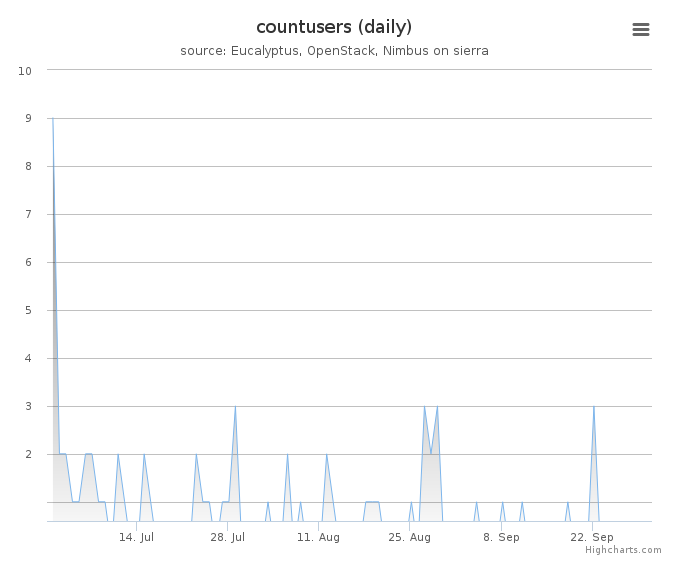
Users count (daily)
Figure 2: Users count
This time series chart represents daily active user count for cloud services and shows historical changes during the period.
  • Period: July 01 – September 30, 2014
  • Cloud(IaaS): nimbus, openstack, eucalyptus
  • Hostname: sierra
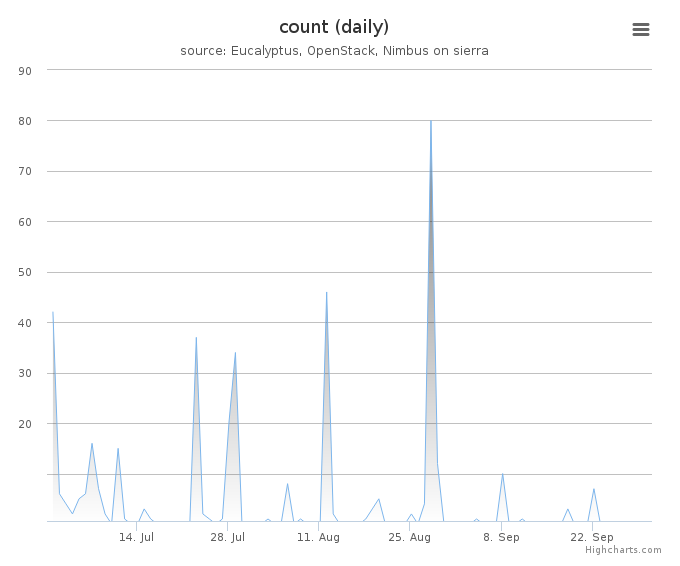
VMs count (daily)
Figure 3: VMs count
This time series chart represents the number of daily launched VM instances for cloud services and shows historical changes during the period.
  • Period: July 01 – September 30, 2014
  • Cloud(IaaS): nimbus, openstack, eucalyptus
  • Hostname: sierra
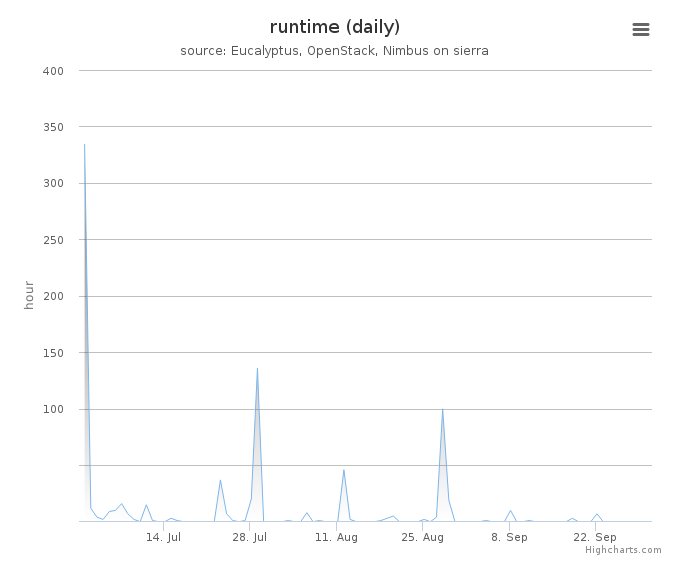
Wall time (hours, daily)
Figure 4: Wall time (hours)
This time series chart represents daily wall time (hours) for cloud services and shows historical changes during the period.
  • Period: July 01 – September 30, 2014
  • Cloud(IaaS): nimbus, openstack, eucalyptus
  • Hostname: sierra

Distribution

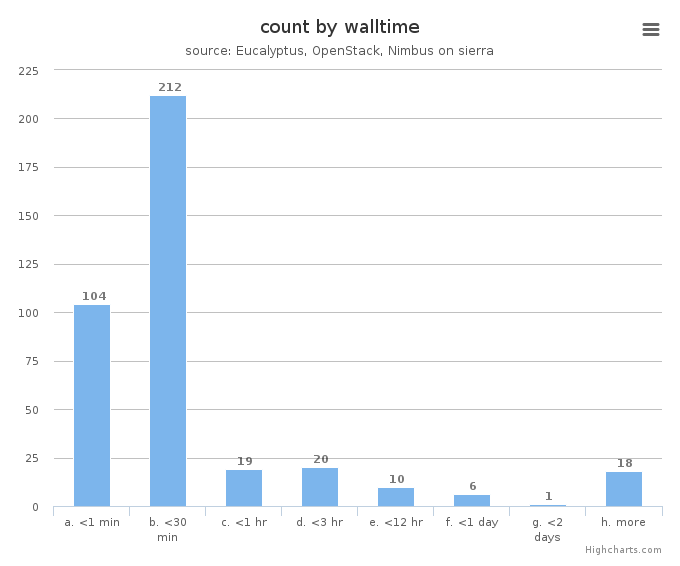
VM count by wall time
Figure 5: VM count by wall time
This chart illustrates usage patterns of VM instances in terms of running wall time.
  • Period: July 01 – September 30, 2014
  • Cloud(IaaS): nimbus, openstack, eucalyptus
  • Hostname: sierra
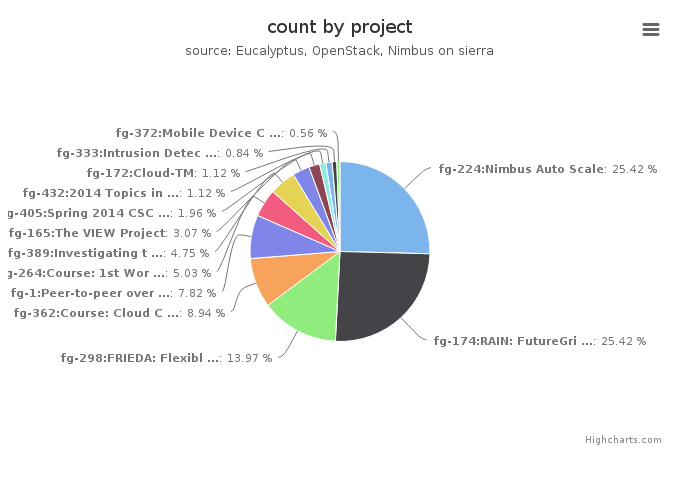
VMs count by project
Figure 6: VMs count by project
This chart illustrates the proportion of launched VM instances by project groups. The same data in tabular form follows.
  • Period: July 01 – September 30, 2014
  • Cloud(IaaS): nimbus, openstack, eucalyptus
  • Hostname: sierra
VMs count by project
Project Value
fg-224:Nimbus Auto Scale 91
fg-174:RAIN: FutureGrid Dynamic provisioning Framework 91
fg-298:FRIEDA: Flexible Robust Intelligent Elastic Data Management 50
fg-362:Course: Cloud Computing and Storage (UF) 32
fg-1:Peer-to-peer overlay networks and applications in virtual networks and virtual clusters 28
fg-264:Course: 1st Workshop on bioKepler Tools and Its Applications 18
fg-389:Investigating the Apache Big Data Stack 17
fg-165:The VIEW Project 11
fg-405:Spring 2014 CSCI-B649 Cloud Computing MOOC for residential and online students 7
fg-432:2014 Topics in Parallel Computation 4
fg-172:Cloud-TM 4
fg-333:Intrusion Detection and Prevention for Infrastructure as a Service Cloud Computing System 3
fg-372:Mobile Device Computation Offloading over SocialVPNs 2
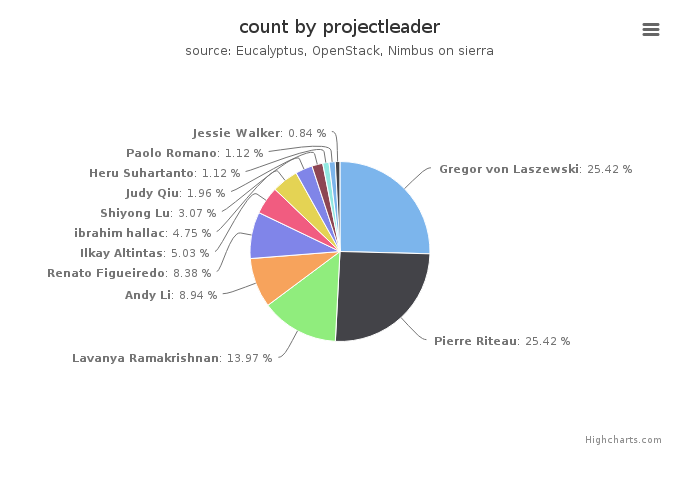
VMs count by project leader
Figure 7: VMs count by project leader
This chart also illustrates the proportion of launched VM instances by project Leader. The same data in tabular form follows.
  • Period: July 01 – September 30, 2014
  • Cloud(IaaS): nimbus, openstack, eucalyptus
  • Hostname: sierra
VMs count by project leader
Projectleader Value
Gregor von Laszewski 91
Pierre Riteau 91
Lavanya Ramakrishnan 50
Andy Li 32
Renato Figueiredo 30
Ilkay Altintas 18
ibrahim hallac 17
Shiyong Lu 11
Judy Qiu 7
Heru Suhartanto 4
Paolo Romano 4
Jessie Walker 3
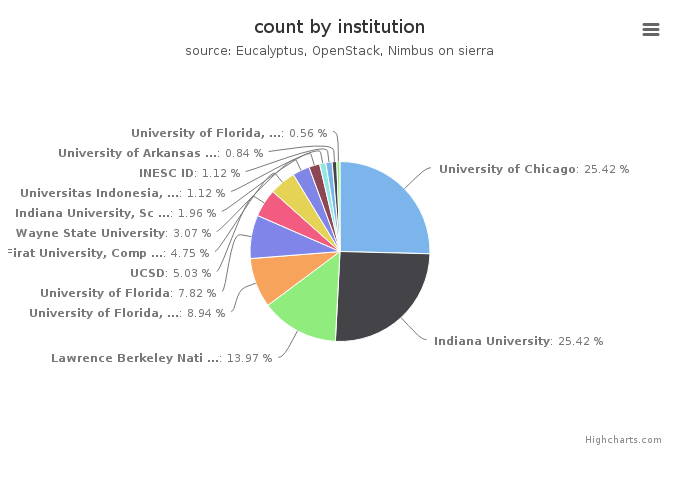
VMs count by institution
Figure 8: VMs count by institution
This chart illustrates the proportion of launched VM instances by Institution. The same data in tabular form follows.
  • Period: July 01 – September 30, 2014
  • Cloud(IaaS): nimbus, openstack, eucalyptus
  • Hostname: sierra
VMs count by institution
Institution Value
University of Chicago 91
Indiana University 91
Lawrence Berkeley National Lab 50
University of Florida, Department of Electrical and Computer Eng 32
University of Florida 28
UCSD 18
Firat University, Computer Science Department 17
Wayne State University 11
Indiana University, School of Informatics and Computing 7
Universitas Indonesia, Faculty of Computer Science 4
INESC ID 4
University of Arkansas at Pine Bluff , Computer Science 3
University of Florida, Electrical and Computer Engineering 2
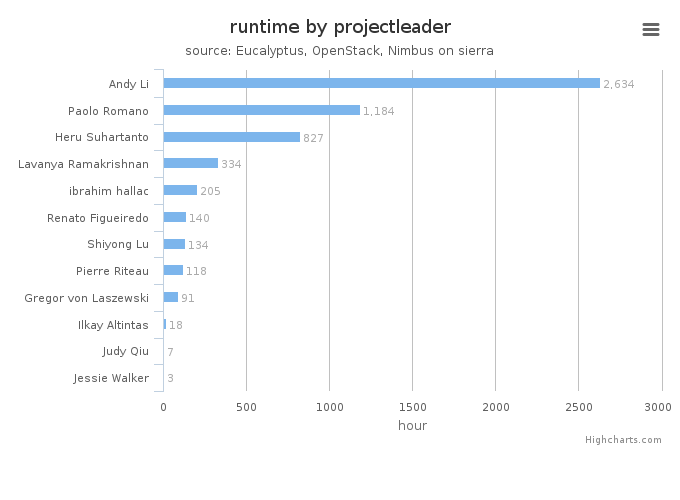
Wall time (hours) by project leader
Figure 9: Wall time (hours) by project leader
This chart illustrates proportionate total run times by project leader.
  • Period: July 01 – September 30, 2014
  • Cloud(IaaS): nimbus, openstack, eucalyptus
  • Hostname: sierra

System information

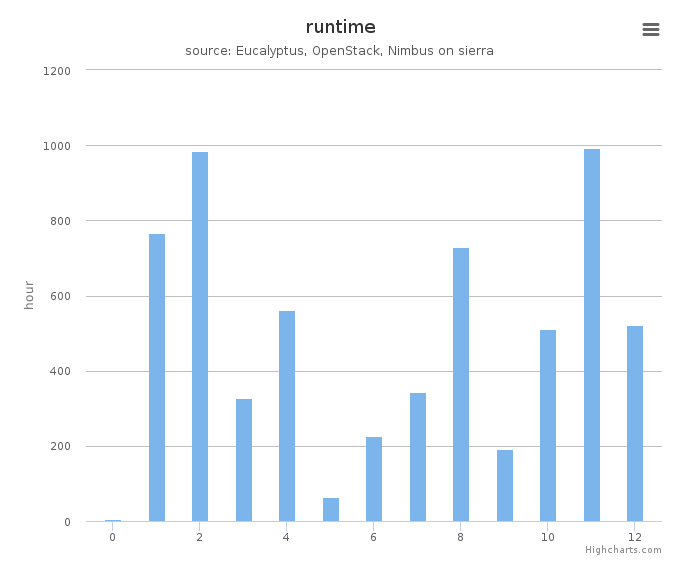
System information shows utilization distribution as to VMs count and wall time. Each cluster represents a compute node.
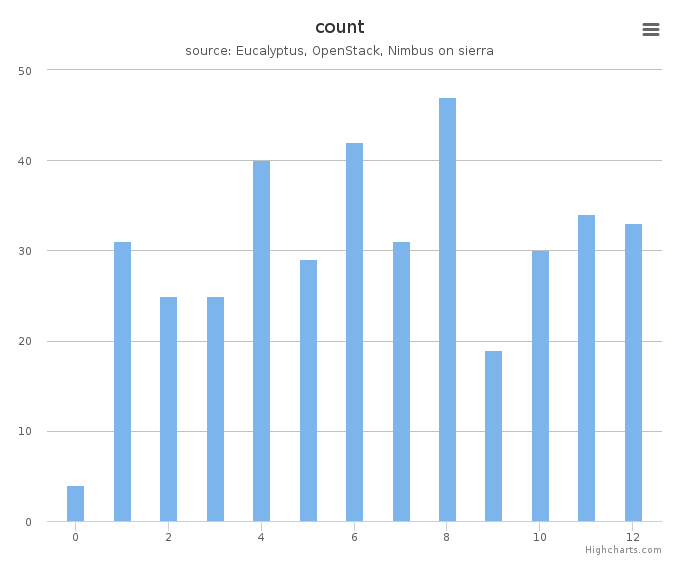
VMs count by systems in Cluster (sierra)
Figure 10: VMs count by systems (compute nodes) in Cluster (sierra)
This column chart represents VMs count among systems.
  • Period: July 01 – September 30, 2014
  • Cloud(IaaS): nimbus, openstack, eucalyptus
  • Hostname: sierra
Wall time (hours) by systems in Cluster (sierra)
Figure 11: Wall time (hours) by systems (compute nodes) in Cluster (sierra)
This column chart represents wall time among systems.
  • Period: July 01 – September 30, 2014
  • Cloud(IaaS): nimbus, openstack, eucalyptus
  • Hostname: sierra