Distribution
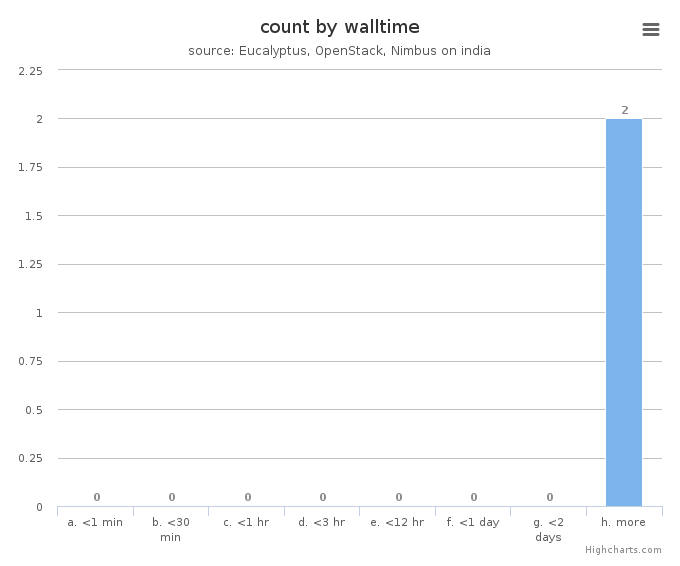
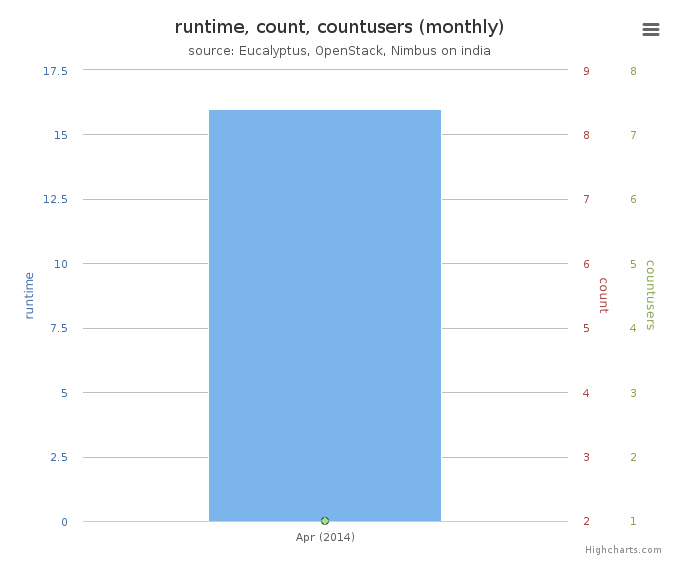
Figure 5: VM count by wall time
This chart illustrates usage patterns of VM instances in terms of running wall time.
- Period: April 01 – April 30, 2014
- Cloud(IaaS): openstack, eucalyptus
- Hostname: india

Figure 6: VMs count by project
This chart illustrates the proportion of launched VM instances by project groups. The same data in tabular form follows.
- Period: April 01 – April 30, 2014
- Cloud(IaaS): openstack, eucalyptus
- Hostname: india

Figure 7: VMs count by project leader
This chart also illustrates the proportion of launched VM instances by project Leader. The same data in tabular form follows.
- Period: April 01 – April 30, 2014
- Cloud(IaaS): openstack, eucalyptus
- Hostname: india

Figure 8: VMs count by institution
This chart illustrates the proportion of launched VM instances by Institution. The same data in tabular form follows.
- Period: April 01 – April 30, 2014
- Cloud(IaaS): openstack, eucalyptus
- Hostname: india

Figure 9: Wall time (hours) by project leader
This chart illustrates proportionate total run times by project leader.
- Period: April 01 – April 30, 2014
- Cloud(IaaS): openstack, eucalyptus
- Hostname: india