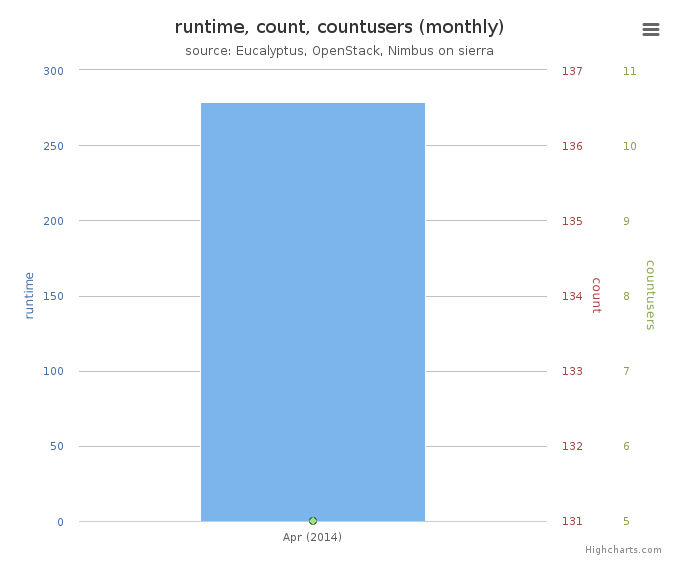
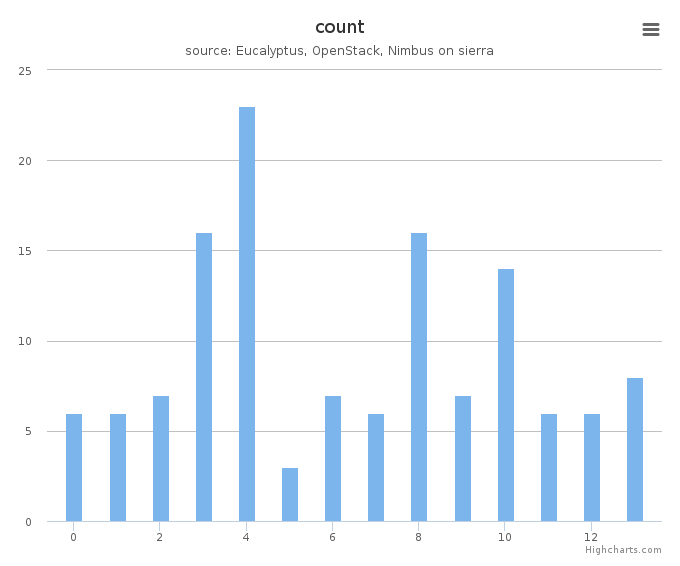
Distribution
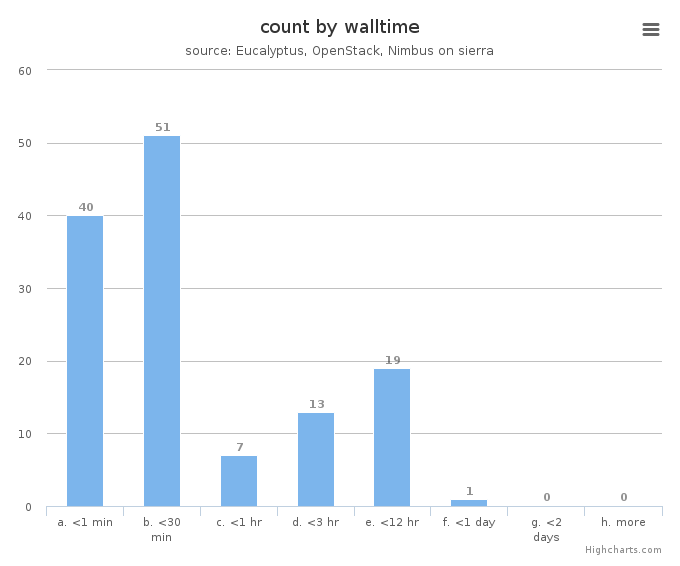
Figure 5: VM count by wall time
This chart illustrates usage patterns of VM instances in terms of running wall time.
- Period: April 01 – April 30, 2014
- Cloud(IaaS): nimbus, openstack, eucalyptus
- Hostname: sierra

Figure 6: VMs count by project
This chart illustrates the proportion of launched VM instances by project groups. The same data in tabular form follows.
- Period: April 01 – April 30, 2014
- Cloud(IaaS): nimbus, openstack, eucalyptus
- Hostname: sierra
VMs count by project
| Project |
Value |
|---|
| fg-367:Optimize rapid deployment and updating of VM images at the remote compute cluster |
45 |
| fg-298:FRIEDA: Flexible Robust Intelligent Elastic Data Management |
29 |
| fg-224:Nimbus Auto Scale |
21 |
| fg-404:Enhancing Usage of cloud Infrastructure |
6 |

Figure 7: VMs count by project leader
This chart also illustrates the proportion of launched VM instances by project Leader. The same data in tabular form follows.
- Period: April 01 – April 30, 2014
- Cloud(IaaS): nimbus, openstack, eucalyptus
- Hostname: sierra
VMs count by project leader
| Projectleader |
Value |
|---|
| Jan Balewski |
45 |
| Lavanya Ramakrishnan |
29 |
| Pierre Riteau |
21 |
| Rahul Limbole |
6 |
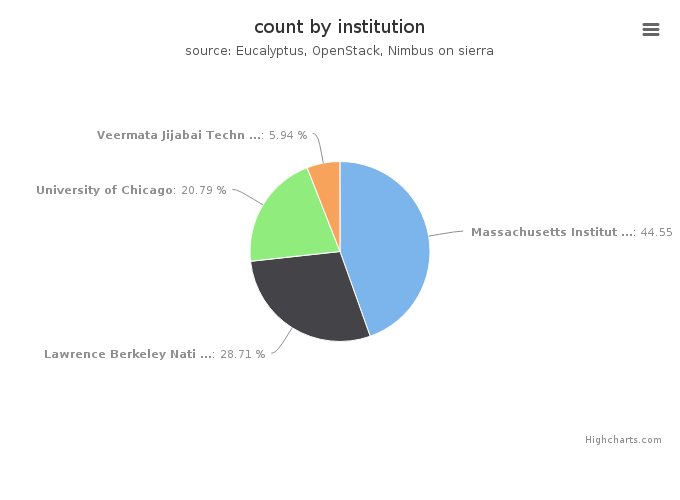
Figure 8: VMs count by institution
This chart illustrates the proportion of launched VM instances by Institution. The same data in tabular form follows.
- Period: April 01 – April 30, 2014
- Cloud(IaaS): nimbus, openstack, eucalyptus
- Hostname: sierra
VMs count by institution
| Institution |
Value |
|---|
| Massachusetts Institute of Technology, Laboratory for Nuclear Sc |
45 |
| Lawrence Berkeley National Lab |
29 |
| University of Chicago |
21 |
| Veermata Jijabai Technological Institute Mumbai, Computer Scienc |
6 |
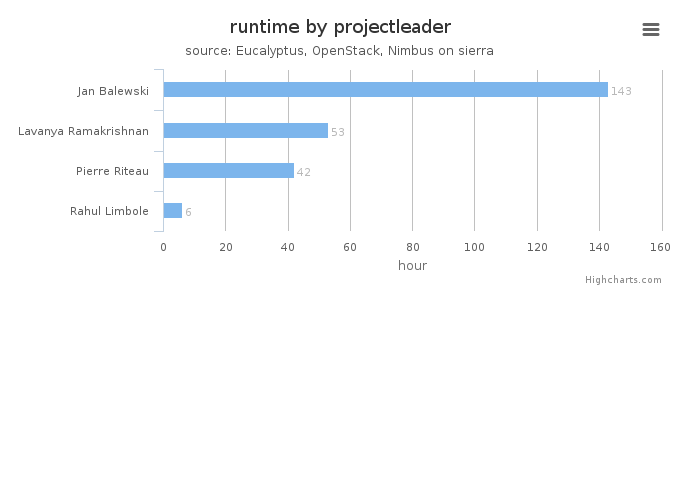
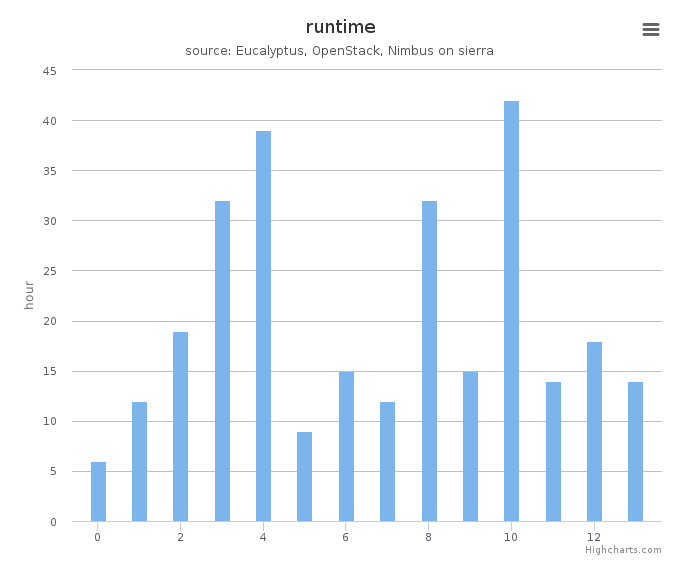
Figure 9: Wall time (hours) by project leader
This chart illustrates proportionate total run times by project leader.
- Period: April 01 – April 30, 2014
- Cloud(IaaS): nimbus, openstack, eucalyptus
- Hostname: sierra