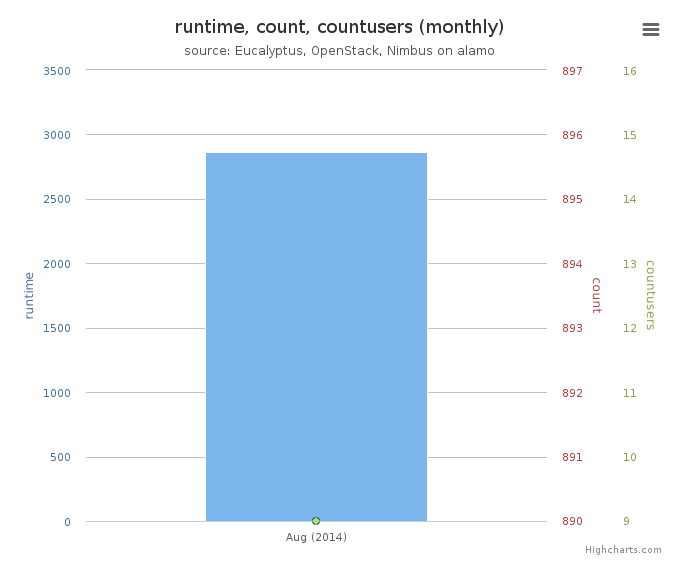
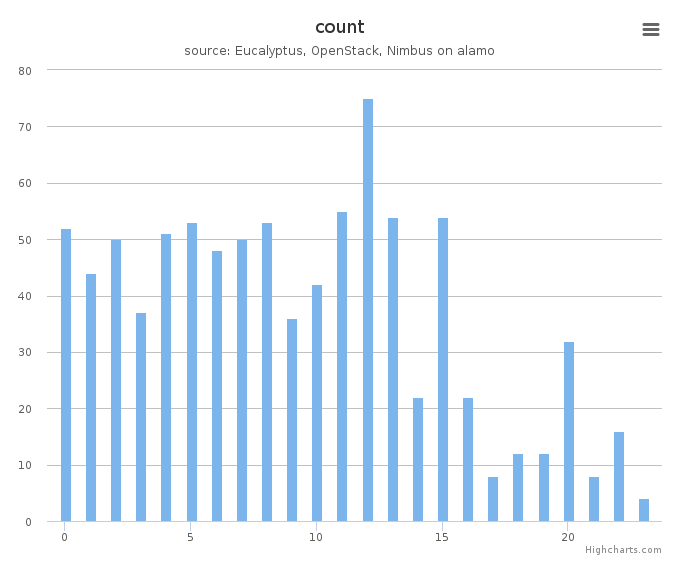
Distribution
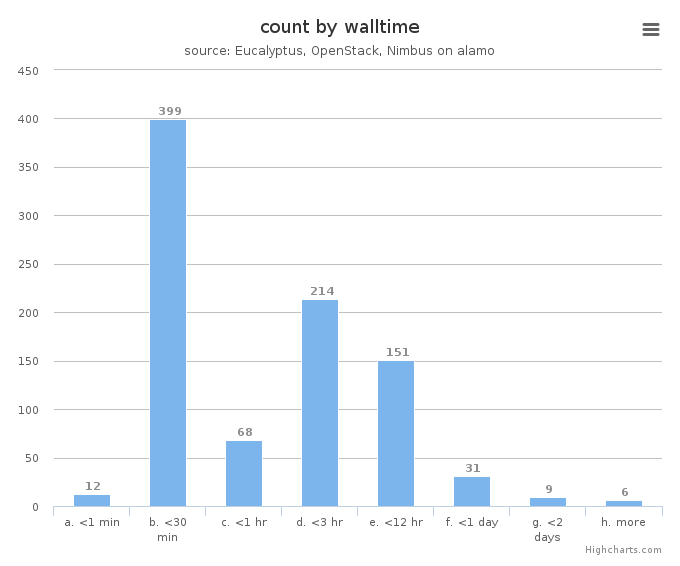
Figure 5: VM count by wall time
This chart illustrates usage patterns of VM instances in terms of running wall time.
- Period: August 01 – August 31, 2014
- Cloud(IaaS): nimbus, openstack
- Hostname: alamo
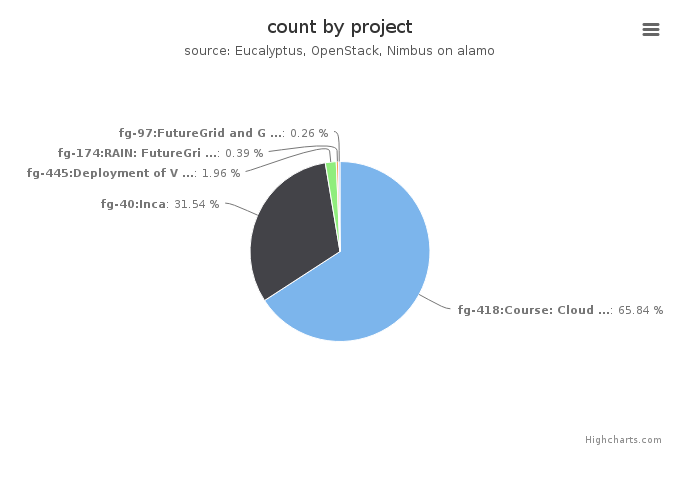
Figure 6: VMs count by project
This chart illustrates the proportion of launched VM instances by project groups. The same data in tabular form follows.
- Period: August 01 – August 31, 2014
- Cloud(IaaS): nimbus, openstack
- Hostname: alamo
VMs count by project
| Project |
Value |
|---|
| fg-418:Course: Cloud Computing Class - fourth edition |
503 |
| fg-40:Inca |
241 |
| fg-445:Deployment of Virtual Clusters on a Commercial Cloud Platform for Molecular Docking |
15 |
| fg-174:RAIN: FutureGrid Dynamic provisioning Framework |
3 |
| fg-97:FutureGrid and Grid‘5000 Collaboration |
2 |
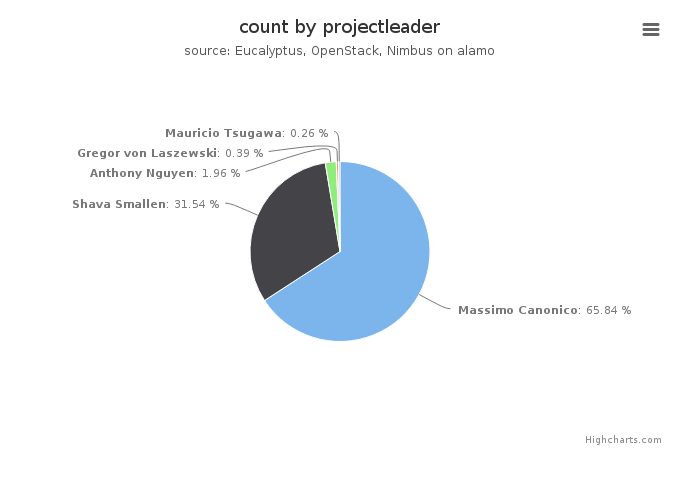
Figure 7: VMs count by project leader
This chart also illustrates the proportion of launched VM instances by project Leader. The same data in tabular form follows.
- Period: August 01 – August 31, 2014
- Cloud(IaaS): nimbus, openstack
- Hostname: alamo
VMs count by project leader
| Projectleader |
Value |
|---|
| Massimo Canonico |
503 |
| Shava Smallen |
241 |
| Anthony Nguyen |
15 |
| Gregor von Laszewski |
3 |
| Mauricio Tsugawa |
2 |
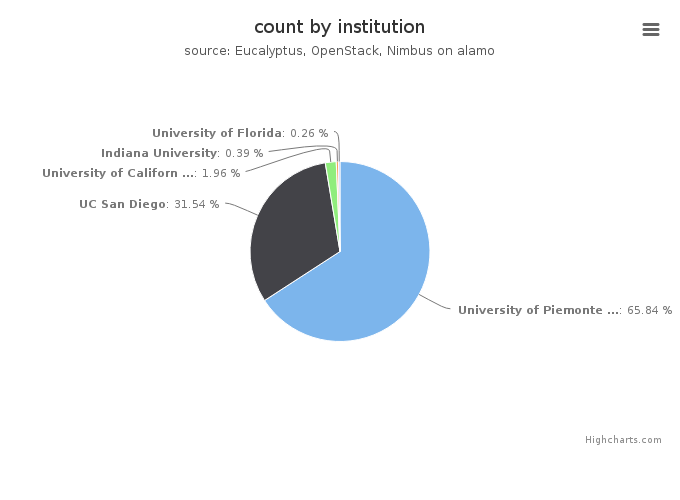
Figure 8: VMs count by institution
This chart illustrates the proportion of launched VM instances by Institution. The same data in tabular form follows.
- Period: August 01 – August 31, 2014
- Cloud(IaaS): nimbus, openstack
- Hostname: alamo
VMs count by institution
| Institution |
Value |
|---|
| University of Piemonte Orientale, Computer Science Department |
503 |
| UC San Diego |
241 |
| University of California, San Diego, PRIME/PRAGMA |
15 |
| Indiana University |
3 |
| University of Florida |
2 |
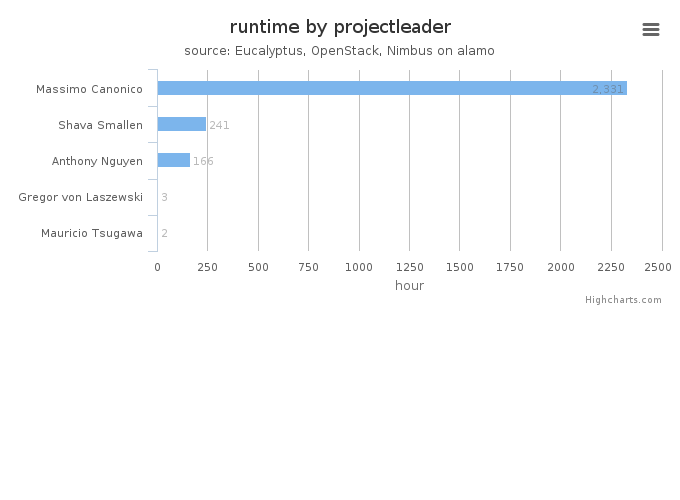
Figure 9: Wall time (hours) by project leader
This chart illustrates proportionate total run times by project leader.
- Period: August 01 – August 31, 2014
- Cloud(IaaS): nimbus, openstack
- Hostname: alamo