Distribution
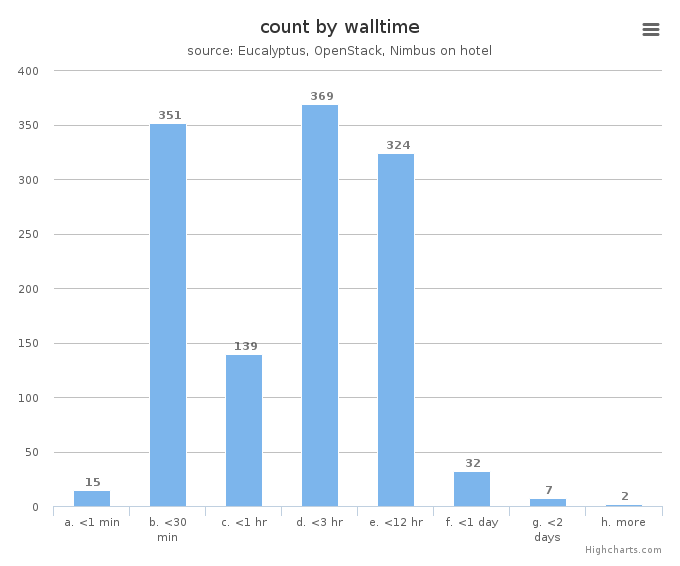
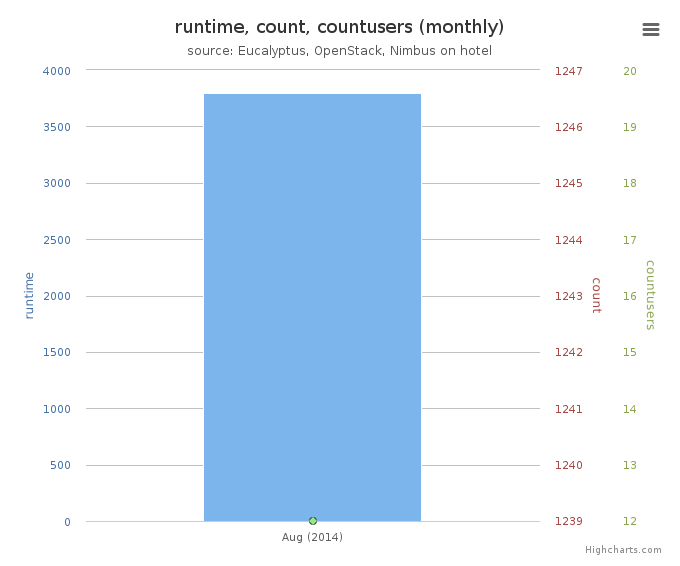
Figure 5: VM count by wall time
This chart illustrates usage patterns of VM instances in terms of running wall time.
- Period: August 01 – August 31, 2014
- Cloud(IaaS): nimbus
- Hostname: hotel
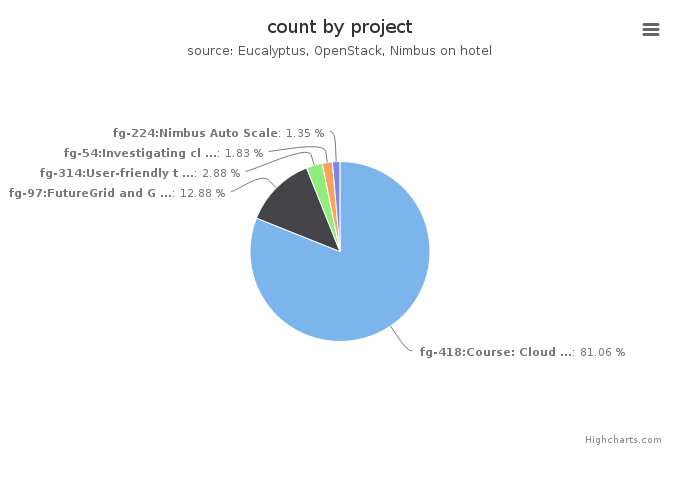
Figure 6: VMs count by project
This chart illustrates the proportion of launched VM instances by project groups. The same data in tabular form follows.
- Period: August 01 – August 31, 2014
- Cloud(IaaS): nimbus
- Hostname: hotel
VMs count by project
| Project |
Value |
|---|
| fg-418:Course: Cloud Computing Class - fourth edition |
843 |
| fg-97:FutureGrid and Grid‘5000 Collaboration |
134 |
| fg-314:User-friendly tools to play with cloud platforms |
30 |
| fg-54:Investigating cloud computing as a solution for analyzing particle physics data |
19 |
| fg-224:Nimbus Auto Scale |
14 |
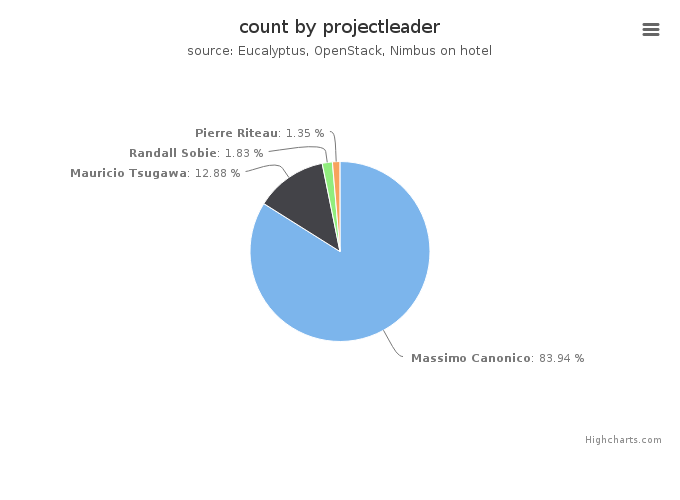
Figure 7: VMs count by project leader
This chart also illustrates the proportion of launched VM instances by project Leader. The same data in tabular form follows.
- Period: August 01 – August 31, 2014
- Cloud(IaaS): nimbus
- Hostname: hotel
VMs count by project leader
| Projectleader |
Value |
|---|
| Massimo Canonico |
873 |
| Mauricio Tsugawa |
134 |
| Randall Sobie |
19 |
| Pierre Riteau |
14 |
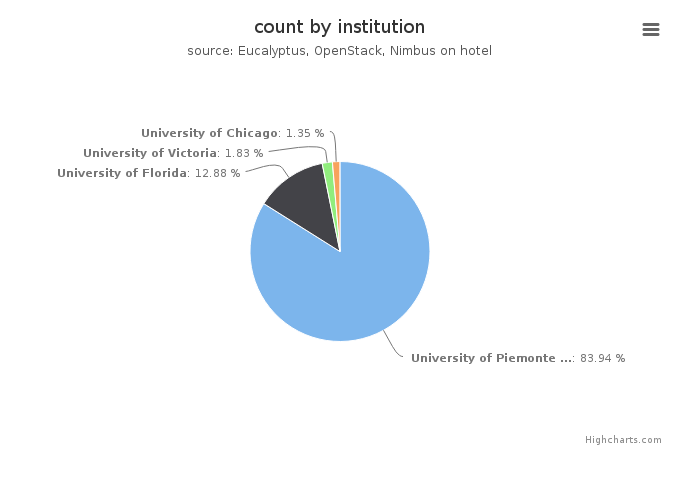
Figure 8: VMs count by institution
This chart illustrates the proportion of launched VM instances by Institution. The same data in tabular form follows.
- Period: August 01 – August 31, 2014
- Cloud(IaaS): nimbus
- Hostname: hotel
VMs count by institution
| Institution |
Value |
|---|
| University of Piemonte Orientale, Computer Science Department |
873 |
| University of Florida |
134 |
| University of Victoria |
19 |
| University of Chicago |
14 |
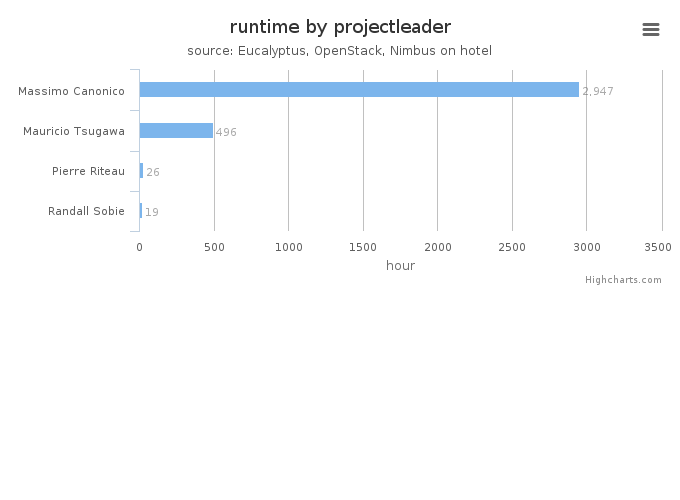
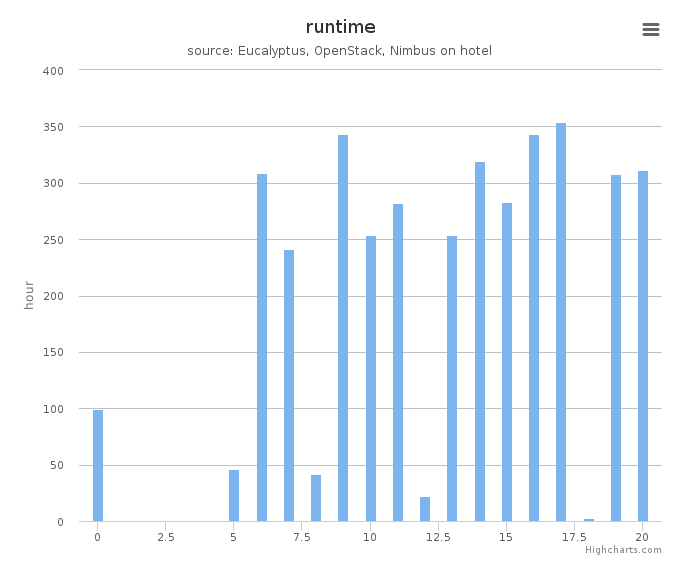
Figure 9: Wall time (hours) by project leader
This chart illustrates proportionate total run times by project leader.
- Period: August 01 – August 31, 2014
- Cloud(IaaS): nimbus
- Hostname: hotel