|
|
FutureGrid Cloud Metric |
|
|
FutureGrid Cloud Metric |
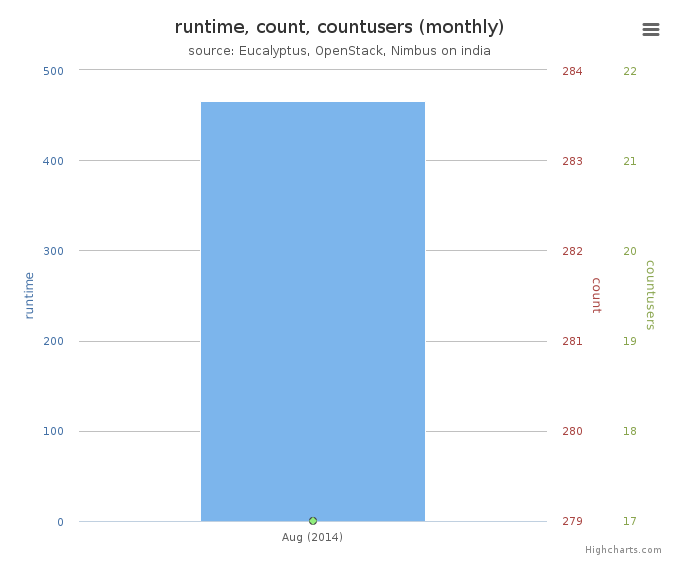
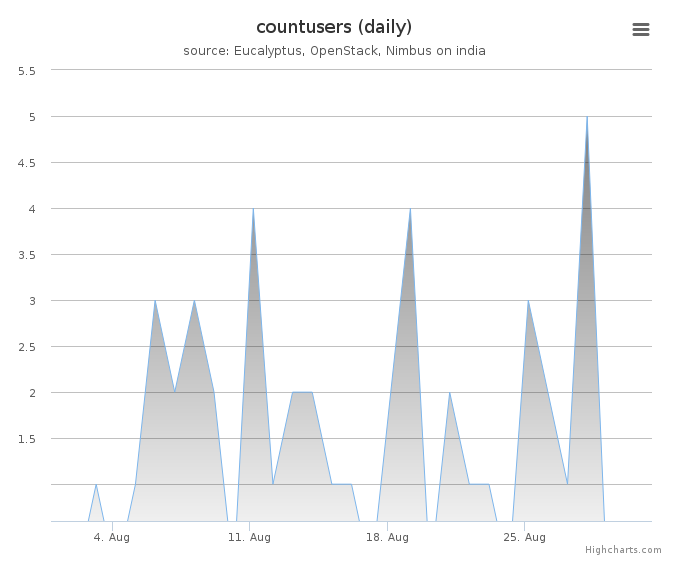
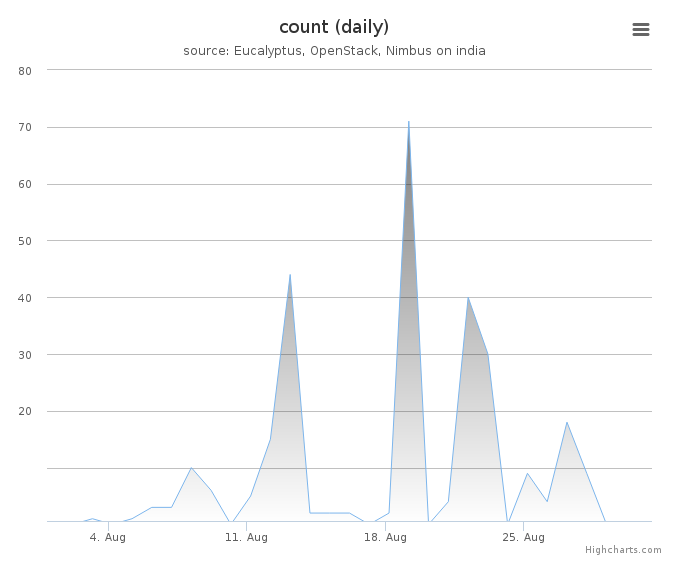
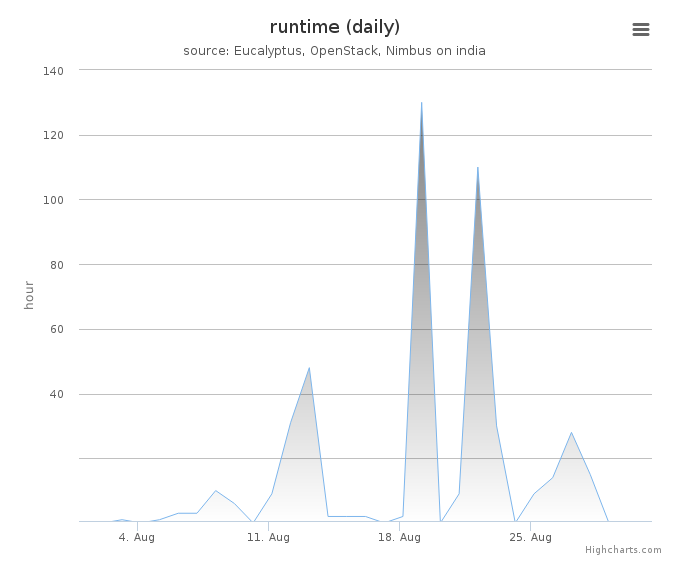
Period: August 01 – August 31, 2014
Cloud(IaaS): openstack, eucalyptus
Hostname: india
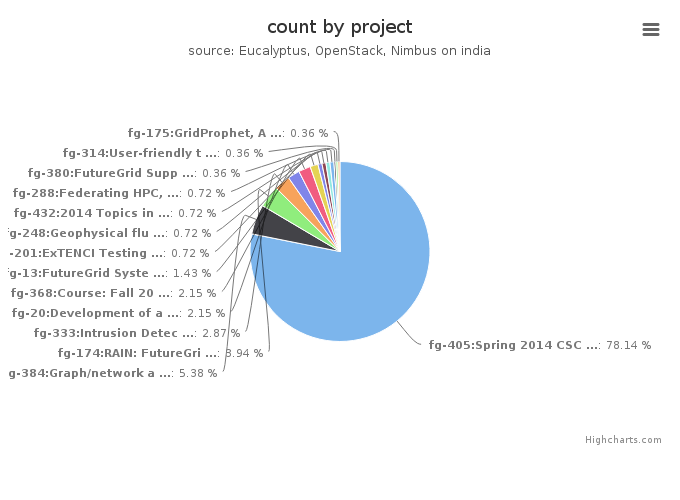
| Project | Value |
|---|---|
| fg-405:Spring 2014 CSCI-B649 Cloud Computing MOOC for residential and online students | 218 |
| fg-384:Graph/network analysis Resource manager | 15 |
| fg-174:RAIN: FutureGrid Dynamic provisioning Framework | 11 |
| fg-333:Intrusion Detection and Prevention for Infrastructure as a Service Cloud Computing System | 8 |
| fg-20:Development of an information service for FutureGrid | 6 |
| fg-368:Course: Fall 2013 P434 Distributed Systems Undergraduate Course | 6 |
| fg-13:FutureGrid Systems Development and Prototyping | 4 |
| fg-201:ExTENCI Testing, Validation, and Performance | 2 |
| fg-248:Geophysical fluid dynamics education and research | 2 |
| fg-432:2014 Topics in Parallel Computation | 2 |
| fg-288:Federating HPC, Cyberinfrastructure and Clouds using CometCloud | 2 |
| fg-380:FutureGrid Support for BigData MOOC | 1 |
| fg-314:User-friendly tools to play with cloud platforms | 1 |
| fg-175:GridProphet, A workflow execution time prediction system for the Grid | 1 |
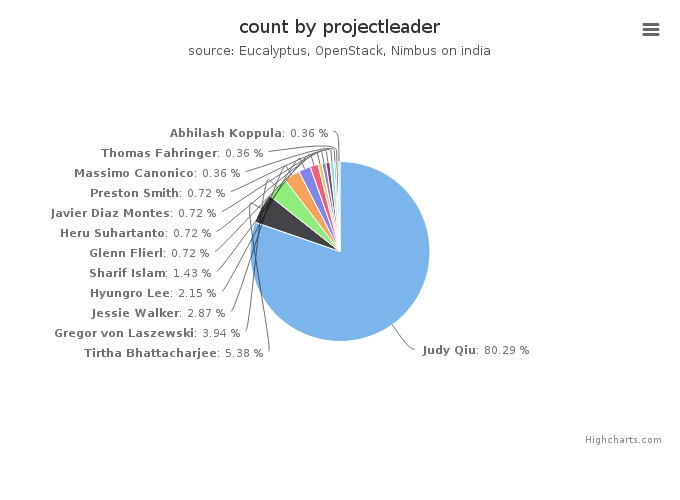
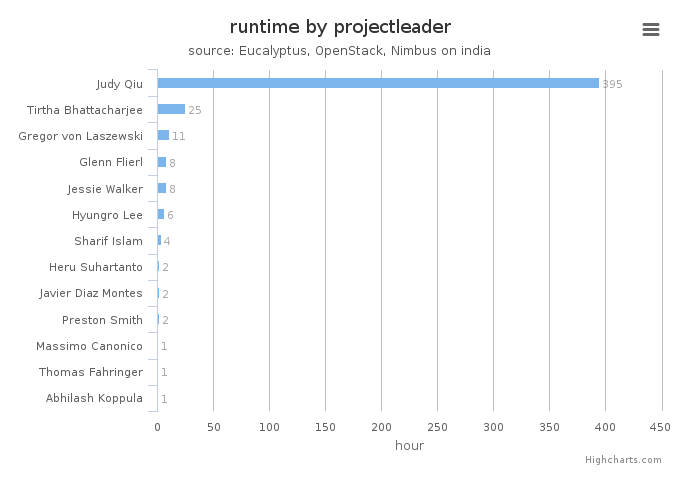
| Projectleader | Value |
|---|---|
| Judy Qiu | 224 |
| Tirtha Bhattacharjee | 15 |
| Gregor von Laszewski | 11 |
| Jessie Walker | 8 |
| Hyungro Lee | 6 |
| Sharif Islam | 4 |
| Glenn Flierl | 2 |
| Heru Suhartanto | 2 |
| Javier Diaz Montes | 2 |
| Preston Smith | 2 |
| Massimo Canonico | 1 |
| Thomas Fahringer | 1 |
| Abhilash Koppula | 1 |
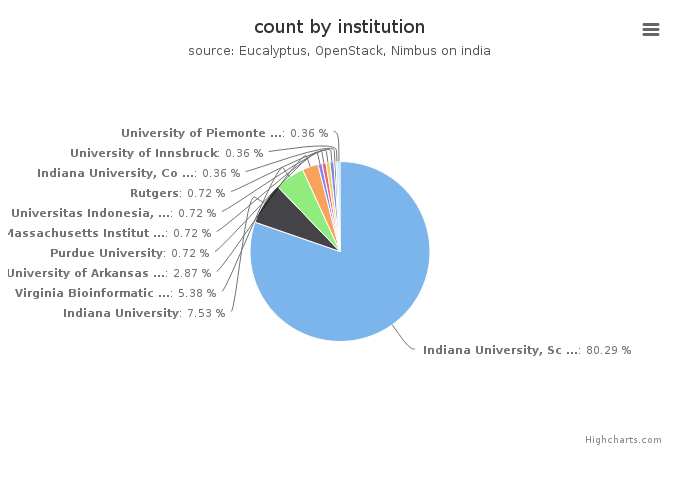
| Institution | Value |
|---|---|
| Indiana University, School of Informatics and Computing | 224 |
| Indiana University | 21 |
| Virginia Bioinformatics Institute, Virginia Polytechnic Institut | 15 |
| University of Arkansas at Pine Bluff , Computer Science | 8 |
| Purdue University | 2 |
| Massachusetts Institute of Technology | 2 |
| Universitas Indonesia, Faculty of Computer Science | 2 |
| Rutgers | 2 |
| Indiana University, Community Grids Lab | 1 |
| University of Innsbruck | 1 |
| University of Piemonte Orientale, Computer Science Department | 1 |
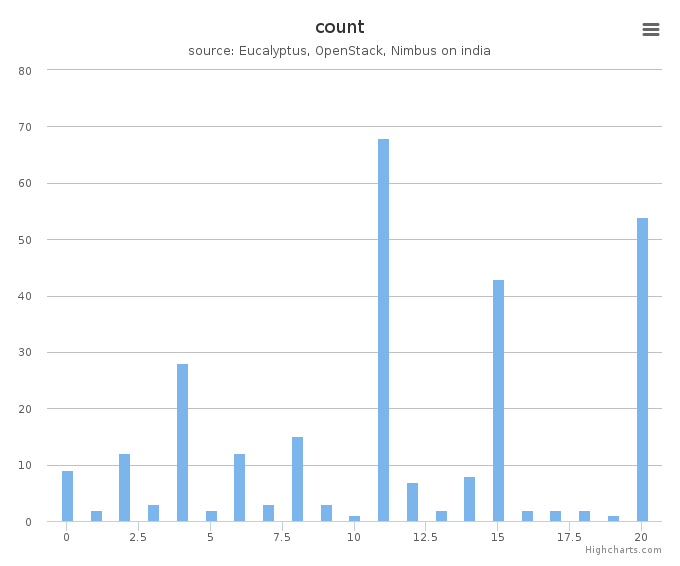
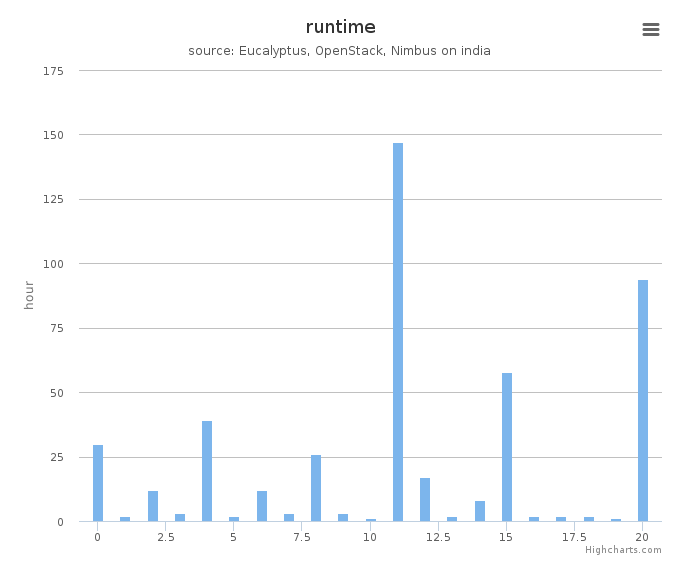
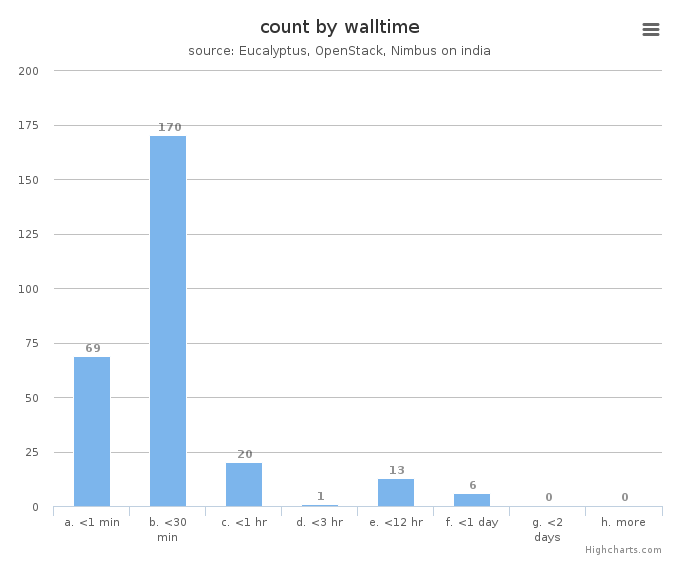
System information shows utilization distribution as to VMs count and wall time. Each cluster represents a compute node.