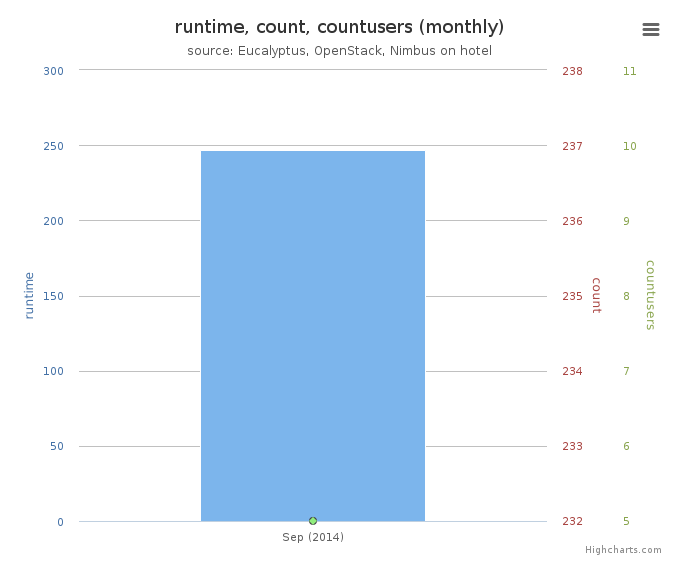
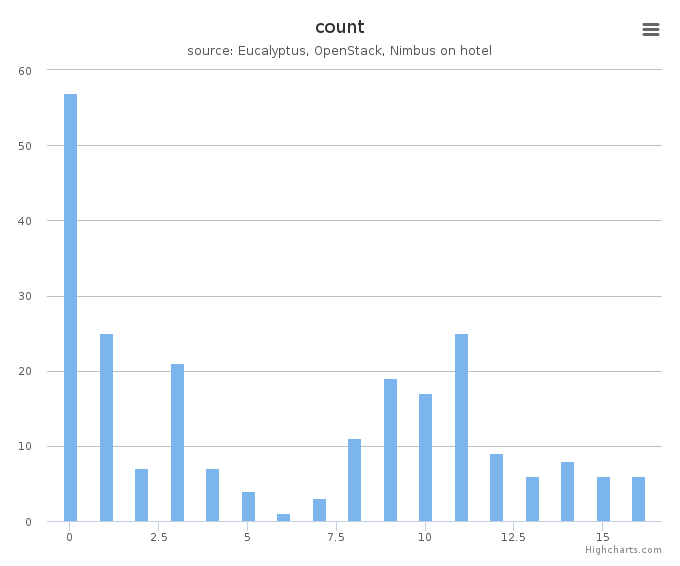
Distribution
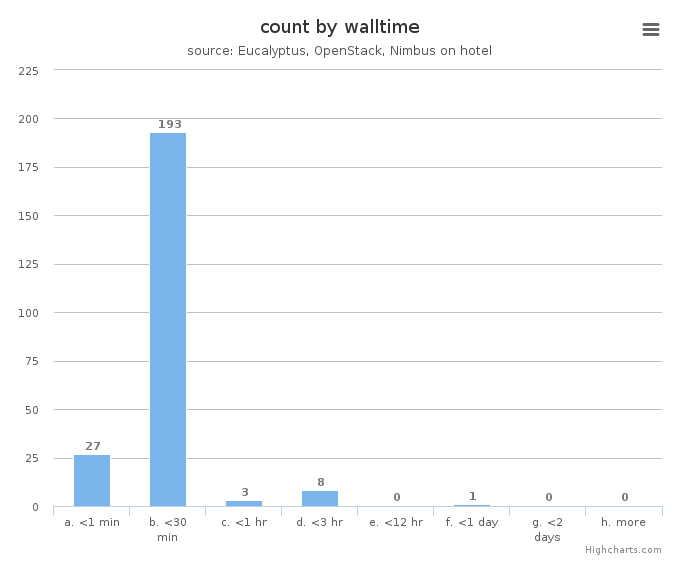
Figure 5: VM count by wall time
This chart illustrates usage patterns of VM instances in terms of running wall time.
- Period: September 01 – September 30, 2014
- Cloud(IaaS): nimbus
- Hostname: hotel
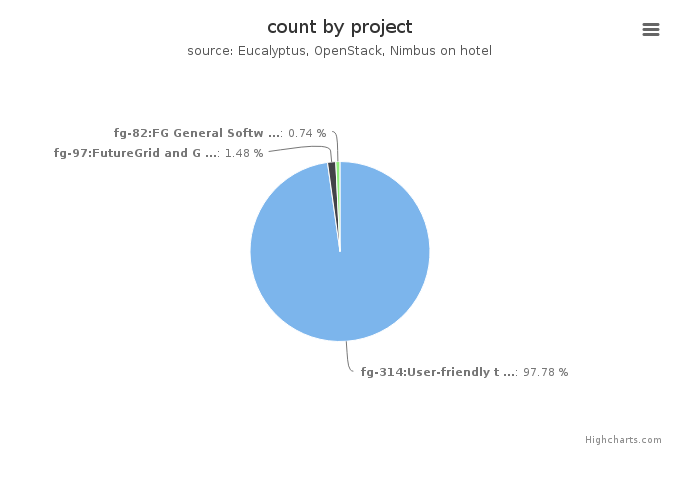
Figure 6: VMs count by project
This chart illustrates the proportion of launched VM instances by project groups. The same data in tabular form follows.
- Period: September 01 – September 30, 2014
- Cloud(IaaS): nimbus
- Hostname: hotel
VMs count by project
| Project |
Value |
|---|
| fg-314:User-friendly tools to play with cloud platforms |
132 |
| fg-97:FutureGrid and Grid‘5000 Collaboration |
2 |
| fg-82:FG General Software Development |
1 |
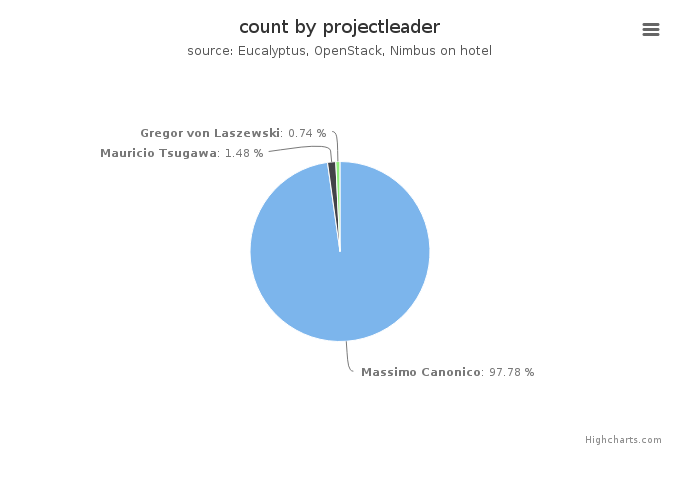
Figure 7: VMs count by project leader
This chart also illustrates the proportion of launched VM instances by project Leader. The same data in tabular form follows.
- Period: September 01 – September 30, 2014
- Cloud(IaaS): nimbus
- Hostname: hotel
VMs count by project leader
| Projectleader |
Value |
|---|
| Massimo Canonico |
132 |
| Mauricio Tsugawa |
2 |
| Gregor von Laszewski |
1 |
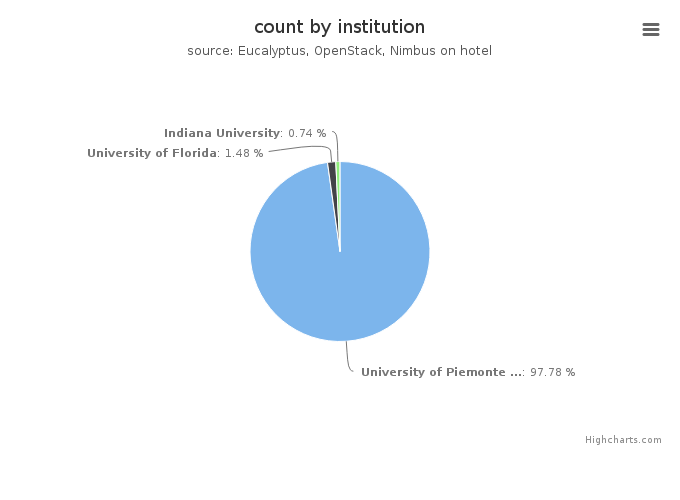
Figure 8: VMs count by institution
This chart illustrates the proportion of launched VM instances by Institution. The same data in tabular form follows.
- Period: September 01 – September 30, 2014
- Cloud(IaaS): nimbus
- Hostname: hotel
VMs count by institution
| Institution |
Value |
|---|
| University of Piemonte Orientale, Computer Science Department |
132 |
| University of Florida |
2 |
| Indiana University |
1 |
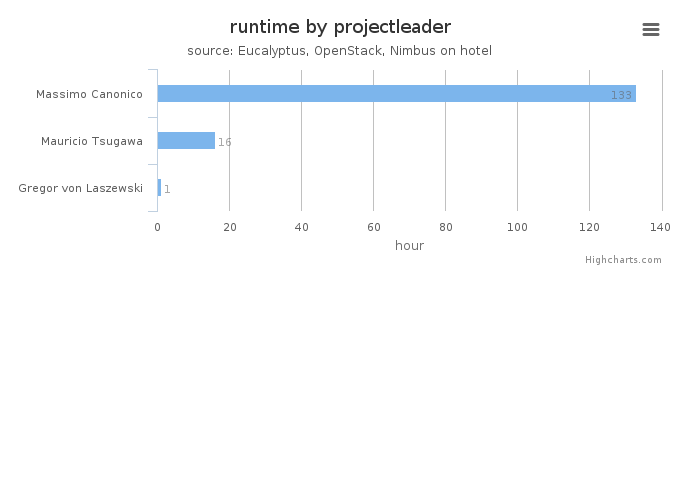
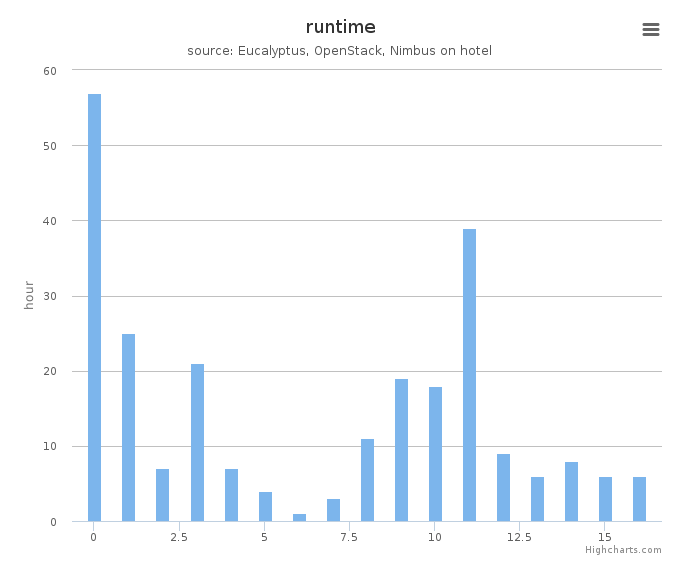
Figure 9: Wall time (hours) by project leader
This chart illustrates proportionate total run times by project leader.
- Period: September 01 – September 30, 2014
- Cloud(IaaS): nimbus
- Hostname: hotel